UNEP: Undertaking Negotiations to Eliminate Plasticization

Next month, formal negotiations will start on a legally binding treaty to end plastic pollution. Although there appears to be little disagreement about the pervasiveness of plastic pollution, how to resolve this will prove problematic. Who should take responsibility for the present situation and how should this influence future responsibilities? Climate negotiators will recognise the similarities.
In December 2021, Planet Tracker’s blog, Heading Towards a Global Plastic Treaty?, examined the negotiating positions of major parties prior to the United Nations Environment Assembly (UNEA) Agreement on a resolution to end plastic pollution. Almost a year later, we provide a negotiation update along with a revised version of our dashboard showing plastic consumption scenarios. It provides an insight into possible negotiating positions.
Policy Update – New players in the game
Global Plastic Treaty
In March 2022, the United Nations approved an agreement to create the world’s first-ever global plastics pollution treaty, adopted upon the conclusion of the resumed fifth session of the United Nations Environment Assembly (UNEA 5.2).1
Initially, the global plastic treaty negotiations will focus on high-level issues. For example, where does the life cycle of a plastic commence? Should negotiators go back to the fossil fuel source or start with the resin manufacturers or when a plastic product is manufactured.2 The structure of the treaty will need agreeing. For example, will the treaty provide a framework whereby protocols are developed in subsequent years? What financial mechanisms are in scope – e.g., taxes or extended product responsibility (EPR) – and what goals should be established, if any – e.g., re-use or recycling targets?
If negotiations run to schedule, by the end of 2024 five different Intergovernmental Negotiating Committee (INC) meetings should have been concluded. The first INC is taking place in November 2022 in Uruguay.3
The role of elections
The country members are in the driving seat. The speed and direction of negotiations is difficult to call at the best of times. Adding to the uncertainty are government elections which can cause environmental negotiating positions to abruptly change.
Australia comes to mind, as does the UK which has a new Prime Minister, as well as new coalitions in Italy and Sweden. Furthermore, there is Brazil’s forthcoming presidential election and US mid-term elections.
Business Coalition for a Global Plastic Treaty
In September 2022, Ellen MacArthur Foundation and WWF formed a new coalition which plans to have an “ambitious” voice in the United Nation’s upcoming global treaty to end plastic pollution. The coalition is currently backed by over 80 different organisations including 21 financial institutions, 24 brand owners and retailers, 14 converters and producers, 6 waste management companies, several business organisations and other companies across the plastics value chain and some NGOs. The partnership “has aligned on a shared vision. This sees the treaty as the key policy mechanism to accelerate progress in three critical areas: the reduction of plastic production and use through a circular economy approach, increased circulation of all necessary plastics and the prevention and remediation of hard-to-abate micro- and macro-plastic leakage into the environment”.4
Taking responsibility
In order to explore the issue of who carries responsibility for the present state of plastic pollution, last year Planet Tracker developed an interactive toolkit which demonstrated the difference between industrial plastic consumption per capita between the developed and developing countries.
Planet Tracker also examined how projections would change with the introduction of the new plastic pollution policies and regulations. The dashboard demonstrates that in 2020, developing countries’ industrial plastic consumption per capita was estimated to be 36kg, while for developed countries the comparable number was 2.5 times higher.
In our updated interactive dashboard, we have added population change as a variable, with the user able to adjust population growth and observe the effect on plastic consumption trajectories. Bear in mind that the dashboard is displaying plastic consumption on a per capita basis.
Forecasting plastic regulation
Planet Tracker has sourced policy data from the WWF Plastic Navigator to assess the likelihood of each country ratifying and actioning a potential plastic pact.
- For countries which have publicly called for a global plastic agreement and therefore have the highest probability of implementing a plastic reduction policy – Planet Tracker applied an 80% probability.
- For those countries which have agreed to consider a treaty and are therefore difficult to call in terms of implementing plastic reduction policies – Planet Tracker applied a 50% probability.
- For countries with no current public commitment to developing plastic reduction policies and therefore have the lowest probability of doing so in the future – Planet Tracker applied a 20% probability.
Even though there is an agreement to start negotiation a Plastic Treaty, we still apply the countries’ original position prior to the Treaty as an indication of their intentions to employ new policy regulation. Following the completion of the first INC meeting, we are expecting to gain a better understanding of the position of the country member and therefore the likelihood of them actioning a potential plastic policy regulation will be revised.
Table 1 shows the total reduction in plastic consumption assumed over each five-year period to 2040, in developed and developing countries, by implementing a plastic framework. These are multiplied by the probabilities given above, along with forecast plastic consumption, to calculate future plastic consumption at each five-year interval because of a policy intervention.
Table 1 Policy induced reductions in total plastic consumption as compared to BAU projections. Source: Planet Tracker calculations.
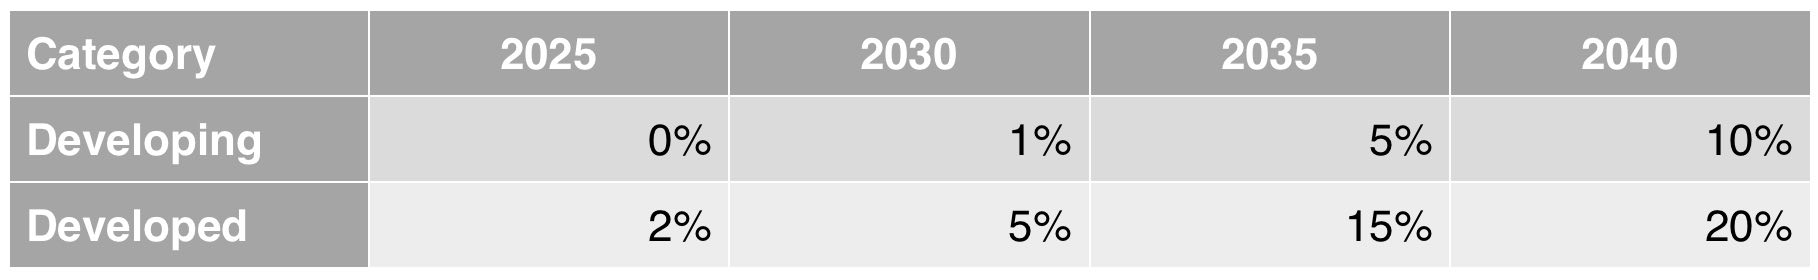
Note that the low numbers used through to 2030, as we have assumed minimal change before 2025 as negotiations are progressing and an implementation period would be needed, which in turn affects the low forecasts through to 2030, then a minor change in the following five-year period. For a fuller explanation of these numbers please read the methodology in the Appendix.
Key takeaways
The key takeaways from the dashboard are as follows:
- If the Business-As-Usual (BAU) model is applied, the consumption gap between the developed and developing countries will differ by only 36 kg per capita in 2040 (33% less than their variance in 2020). In contrast, the policy-adjusted model shows that the difference in consumption between these two categories narrows to 12.3 kg per capita, as that the forecast assumes the developed countries will reduce their consumption by 15% in 2040 – see Figure 1.
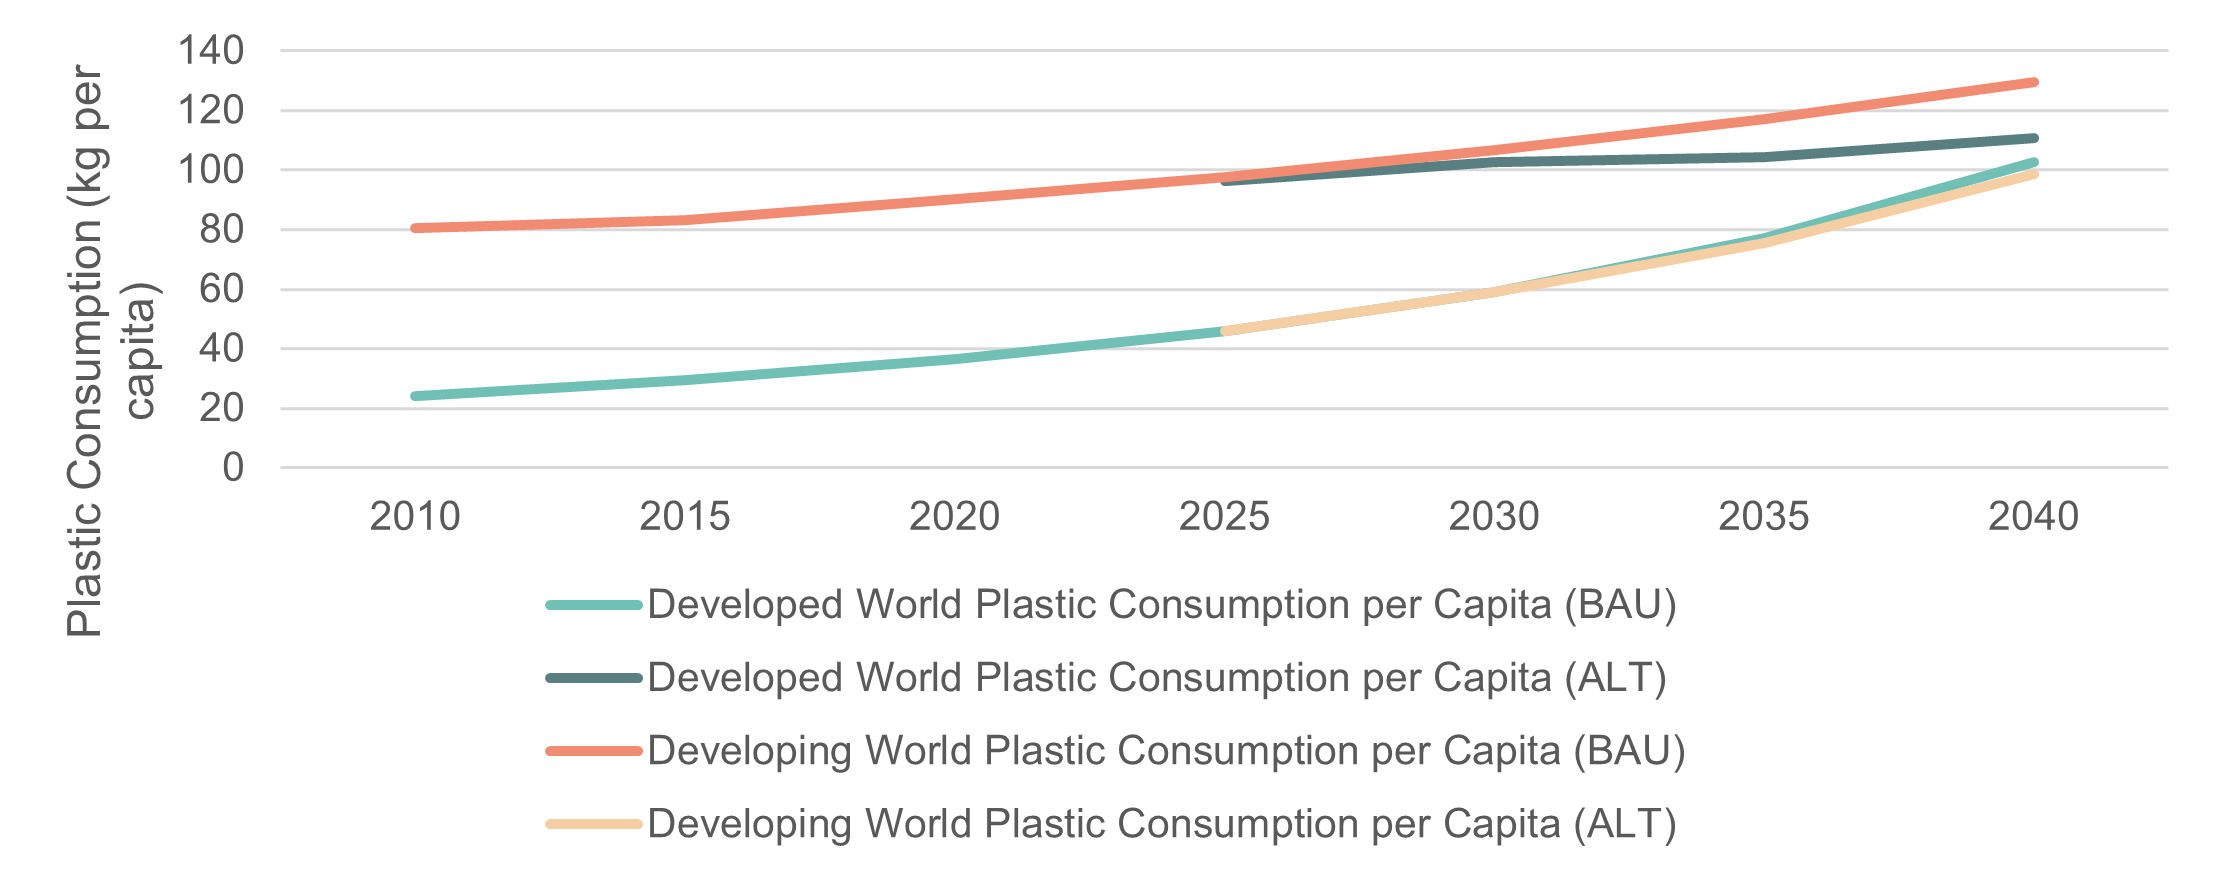 Figure 1 Industrial plastic consumption per capita/population forecasts – developed vs. developing countries. Source: Planet Tracker calculations – see Methodology in Appendix.
- If historic data is used to make projections of future industrial plastic consumption, and no additional plastic regulation is assumed, the gap between these two groups closes from 2.5x in 2020 to 1.3x by 2040. This is because, under a BAU scenario, developed countries increase their consumption to 130 kg per capita by 2040, a 44% increase compared to the 2020 level, while developing countries raise their consumption by a more dramatic 186% to reach 103 kg per capita by 2040.
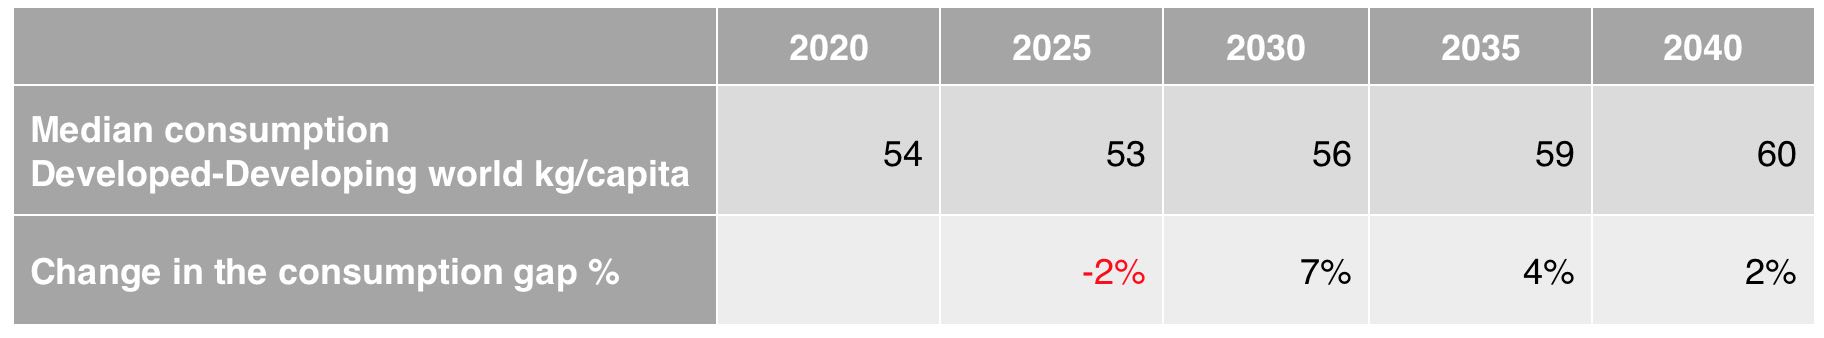
- Based on UN projections, in 2040, the population in comparison to 2020 is projected to increase by 13% in the developed world and by 51% in the developing world.5,6 According to the UN population projections and under a BAU model, the gap between the developed and developing countries will rise by 7% in 2030 and will continue rising but by lower increases and will reach a total gap of 60kg per capita in 2040 – see Table 2.
Table 2 Plastic consumption assumptions based on population projections. Source: IMF (actual population 2020), UN (2025-2040 population projections), Planet Tracker calculations
- China forecasted to see an increase of 209% in the plastic consumption per capita by 2040 (from 71.1 kg in 2020 to 219.6 kg per capita by 2040). As it stands there is no policy-adjusted plastic plan – see Figure 2.
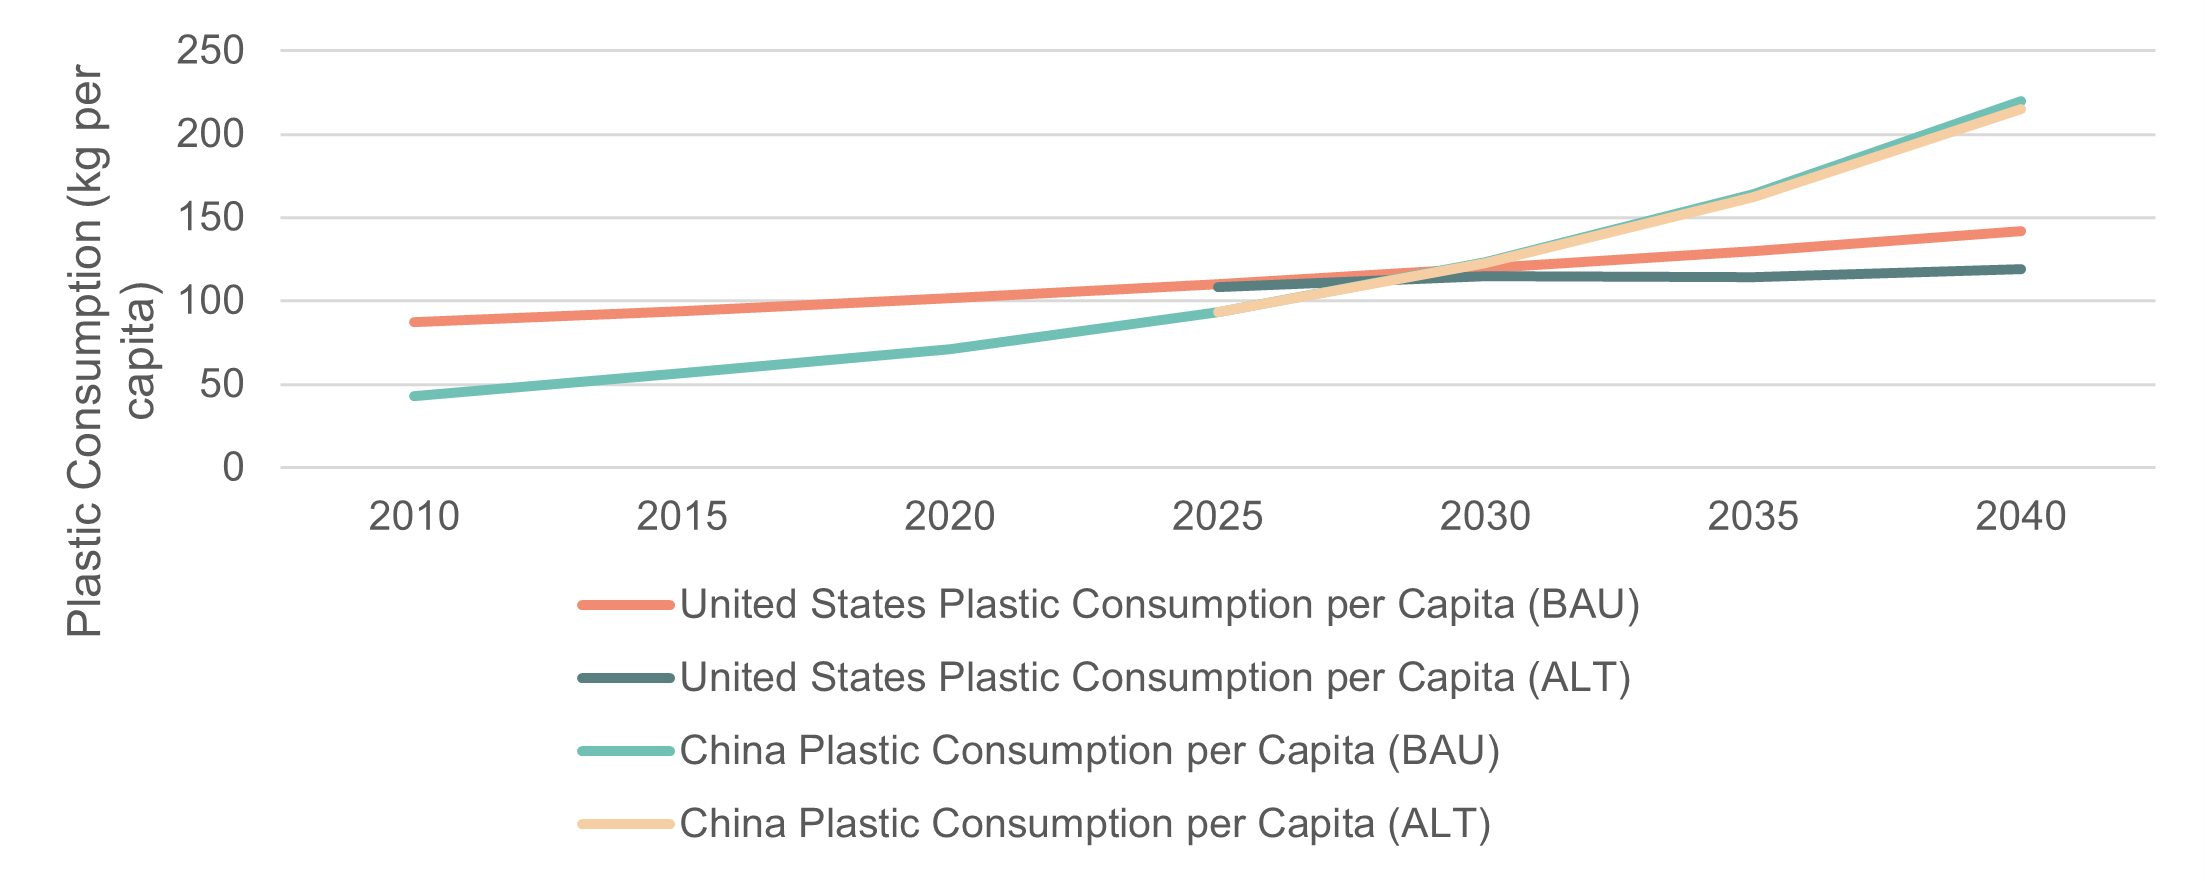
Figure 2 Industrial plastic consumption per capita/population forecasts – US vs. China. Source: Planet Tracker calculations – see methodology in Appendix.
To view the plastic industrial consumption mapping data in more detail, please visit the Plastic Projections dashboard.
- In the US, the current plastic consumption is 101.7 kg per capita and if the BAU model is applied, it will increase by 40% by 2040 (to 141.9 kg per capita). If a stricter regulation of plastic reduction is applied, then there is the possibility of reducing the increase of the plastic consumption to 119.2 kg per capita.
- China’s plastic consumption is currently one-third less than the United States on a per capita basis, despite showing a marked upward trend in recent years. Given the rate at which China is increasing its plastic consumption, the gap could close with the United States by 2030, and by 2040 China may have per capita plastic consumption that is 1.5x higher than the US. Only with an additional 20% reduction on top of the values given in Table 1 will China consistently consume less than the US until 2040.
What the future brings
The first meeting of the Intergovernmental Negotiating Committee (INC-1) will take place in Uruguay from 28 November to 2 December.7
Negotiators face a formidable challenge. There are still questions about responsibility for the present plastic pollution problem. How will existing plastic consumption levels affect negotiations – will developed countries be prepared to lower their consumption and will they be prepared to help finance a plastic transition to zero waste in the developing world?
The disturbing news is that even with a scaling back of plastic consumption in the developed world, it will take 20 years for developed countries to reduce per capita plastic consumption to equal that of the developing countries.
Note: following the commencement of the INC meetings, which are expected to give an update on the country member’s intentions, framework and potential policy implementation, Planet Tracker will revise the current toolkits and provide further information on the findings.
APPENDIX
Methodology, Assumptions and Limitations of Data
Methodology
The industrial plastic consumption is sourced from EuroMap, Europe’s Association for plastics and rubber machinery manufacturers. The data depicts production and consumption as well as export and import data. It covers the period 2009 through 2015. In addition, it estimates production and consumption until 2020. Resins data include PVC, PE (HD-PE, LD-PE, LLD-PE), PP, PS (crystal, high impact), PET Resin (bottle grade), ABS, SAN, PA (PA6, PA66) and PC.
The WWF Global Plastic Navigator is used to assess 63 countries’ stances towards a potential plastic treaty. Countries are classified in three categories and the probability of a national policy (i.e., the likelihood of countries imposing a reduction in plastic consumption) for each classification is as follows:
- Publicly called for new agreement: 80%
- Agreed to consider option of agreement: 50%
- No public statement of support recorded: 20%
The 63 countries in the dataset were mapped into categories using the World Bank Income Group Classification. Based on such categorisation, we assigned low income, low middle income and upper middle-income countries to the “developing country” category, and high income to “developed”.
IMF data was used to gather historical population statistics for the 63 countries in the dataset. This is used to calculate plastic consumption per capita. UNSD was used to gather population forecasts up until 2040 for the 63 countries in the dataset. Medium variant used in the population forecasts.
A Monte Carlo simulation was used to calculate plastic consumption per capita forecasts. Monte Carlo is a multiple probability simulation, predicting a set of outcomes based on an estimated range of values versus a set of fixed input values. In this case, the fixed values represent the past plastic consumption datapoints; these are first resampled, then randomly selected, forming the projection baseline. Before a policy-induced projection is made, each country’s probability of policy action is brought in and multiplied to the projected forecast.
The results for each country are:
- A BAU plastic consumption projection in kt
- A policy-adjusted plastic consumption projection in kt
By using population projections from the USDN, per capita numbers on both variables can be calculated. These are displayed in five-year intervals. This analysis shows when country and group lines intersect – i.e., when would developing world catch up on developed world?
Modelling assumptions
We assume that the plastic consumption projections predicted by EuroMap stand true as of 2020. The country categorisation assumes that developed countries are likely to engage in plastic reducing policies more quickly and decisively than developing counterparts, largely because of their higher consumption numbers. As a result, we assume that in the following time periods, the rate of plastic consumption reduction resulting from policy action will be:
- 2020 to 2025 – 2% for developed countries, no change for developing countries
- 2025 to 2030 – 5% for developed countries, 1% for developing countries
- 2030 to 2035 – 15% for developed countries, 5% for developing countries
- 2035 to 2040 – 20% for developed countries, 10% for developing countries
These % reductions are intended to be reductions as compared to the normal BAU projections and are multiplied by the probability of action previously calculated.
Limitations
Plastic consumption is assumed to be the same as industrial plastic consumption, hence the plastic used in manufacturing applications. Rather than depicting demand, the model identifies the supply capacity in each country within the dataset. While it does not show the amount of plastic being used by the average household, nonetheless it provides a good starting point in understanding the size of the plastic production industry in each country in the sample.
Data covers 63 countries worldwide, with real observations only covering to 2015. Projections are instead used from 2016 onwards.
A Monte Carlo simulation is only as good as the number of observations we have – in other words the more observations we have, the better projections we can yield. Unfortunately, 12 annual datapoints (of which 5 are projections) casts a significant limitation.
Sources:
- Policies: WWF Global Plastic Navigator8
- Data: EuroMap9, IMF, UNSD10, World Bank11, WWF Global Plastic Navigator
References
1 United Nations Environment Assembly of the United Nations Environment Programme, March 2022, Resolution adopted by the United Nations Environment Assembly on 2 March 2022
2 UNEP, September 2022, https://wedocs.unep.org/bitstream/handle/20.500.11822/40721/K2221859%20-%20UNEP-PP-INC.1-11%20-%20ADVANCE.pdf
3 https://www.unep.org/events/conference/inter-governmental-negotiating-committee-meeting-inc-1
4 Business Coalition for a Global Plastic Treaty, 2022, https://www.businessforplasticstreaty.org/
5 UNSD, United Nations Statistics Division, Population Forecasts , 2019, https://population.un.org/wpp/Download/Standard/Population/
6 IMF, International Monetary Fund, Actual Population 2020 data, 2021, https://data.imf.org/?sk=4C514D48-B6BA-49ED-8AB9-52B0C1A0179B&sId=1390030341854
7 UNEP INC Uruguay, 2022, https://www.unep.org/events/conference/inter-governmental-negotiating-committee-meeting-inc-1
8 WWF, Worldwide Fund for Nature, Global Plastic Navigator, 2021, https://plasticnavigator.wwf.de/#/en/policy/?st=0&ch=0&layers=surface-concentration%7Cpolicy-commitments-area&mview=89.52486%7C-482.34375%7C-89.52486%7C843.04688&info=policy-commitments-area%7Ccountries
9 EuroMap, https://www.euromap.org/
10 United Nations, Department of Economic and Social Affairs, Population Division, World Population Prospects 2022,https://population.un.org/wpp/Download/Standard/Population/
11 World Bank, Inflation, consumer prices (annual %), https://data.worldbank.org/indicator/FP.CPI.TOTL.ZG?view=chart