Heading Towards a Global Plastic Treaty?

A revival of calls for a global plastic treaty is encouraging. There is a general recognition that there is a global plastic pollution problem, however, despite previous attempts to tackle this, little progress has been made. This time it looks more positive. Negotiating positions are coalescing and a timetable to move forward is solidifying. Planet Tracker examines the state of play.
What is different this time?
Plastic pollution was debated at United Nations Environmental Assemblies in 2015, 2017 and 2019 and received further impetus from the Ministerial Conference on Marine Litter and Plastic Pollution in Geneva, Switzerland, co-convened in September 2021 by the Governments of Ecuador, Germany, Ghana and Vietnam. Since then, according to the WWF Global Plastic Navigator, 154 countries have expressed an interest in negotiating a new global agreement on marine plastic pollution. Recently, U.S. Secretary of State Anthony Blinken announced the United States’ support for multilateral negotiations on a global agreement to combat ocean plastic pollution.[i]
Although the majority of countries are in favour of a new global agreement on marine plastic pollution, a small but significant group of countries, which includes China, Central Asia and the Gulf countries, have not, to date, issued any public statement in support of a global treaty and one country, India, has only agreed to consider its position.[ii]
Looking Ahead
Further discussions on plastic are scheduled at the next United Nations Environment Assembly (UNEA 5.2), from 28 February to 2 March 2022.
Two alternative drafts of legally binding international agreements are on the table.
Proposal 1
The first is proposed by Rwanda and Peru and co-sponsored by Chile, Colombia, Costa Rica, Ecuador, the EU and its Member States, Guinea, Kenya, Madagascar, Norway, Philippines, Senegal, Switzerland and Uganda. This proposal has been submitted to the UN Environment Assembly (UNEA) Secretariat.
It calls on the UNEA to establish an Intergovernmental Negotiating Committee (INC) for a new global agreement on the full life cycle of plastics based on a comprehensive approach to prevent and reduce environmental pollution by plastics, including microplastics.[iii]
Proposal 2
The second, sponsored by Japan, calls on the UNEA to establish an INC with the mandate to prepare an international legal instrument to address marine plastic pollution, while “taking into account respective national circumstances”.[iv] At the time of writing this was still a working paper and has not yet been submitted to UNEA.
Different Ambitions
What both proposals have in common is the demand to establish an INC. However, there is a fundamental difference in their proposed remits. The Rwanda-Peru proposal suggests covering “all stages of the plastic life cycle and adopting a circular economy approach” and focusing “on both upstream and downstream activities and measures”. On the other hand, Japan’s working paper is more restrictive, suggesting “a comprehensive approach to address marine plastic pollution covering the whole life cycle’’ with “a common objective to reduce marine plastic pollution”.
Table 1: Comparing the Two Plastic Proposals to Establish an Intergovernmental Negotiating Committee (INC) with a Mandate to Negotiate a Legally Binding Global Agreement on Plastics[v], [vi]

If a common proposal to tackle plastic pollution does emerge at the next UNEA meeting, it appears inevitable that the issue of who carries the responsibility for the present state of global plastic pollution will be raised.
Who is Responsible for Plastic Pollution?
In Figure 1 we show the marked difference between industrial plastic consumption[1] per capita between the developed and developing countries. In 2020, developing country industrial plastic consumption per capita is estimated to be 36 kg while for developed countries it is 2.5x higher.
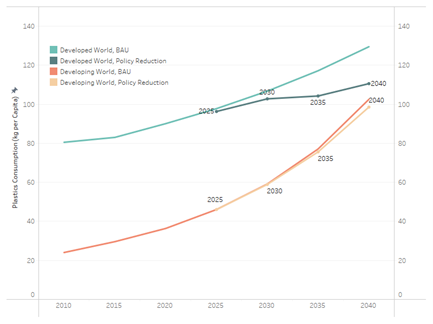
Figure 1: Industrial Plastic Consumption per Capita Forecasts – Developed vs. Developing Countries[vii]
Source: Planet Tracker calculations. See methodology in Appendix.
If we use historic rates to make projections of future industrial plastic consumption, and assume no additional plastic regulation, the gap between these two groups closes from 2.5x in 2020 to 1.3x by 2040. This is because, under a BAU scenario, developed countries increase their consumption to 130 kg per capita by 2040, a 44% increase compared to the 2020 level, while developing countries raise their consumption by a more dramatic 186% to reach 103 kg per capita by 2040.
However developed countries could significantly reduce their demand for plastic if they adopted the right policies (as shown in Figure 1). We have used data from the WWF Plastic Navigatorii to assess the likelihood of each country ratifying and actioning a potential plastic pact.
- Countries which have publicly called for a global plastic agreement have the highest probability of implementing a plastic reduction policy – Planet Tracker applied an 80% probability.
- Those countries which have agreed to consider a treaty have a 50:50 chance of implementing plastic reduction policies – Planet Tracker applied a 50% probability.
- Countries with no current public commitment to developing plastic reduction policies have the lowest probability of doing so in the future – Planet Tracker applied a 20% probability.
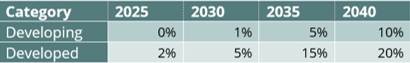
Table 2 shows the total reduction in plastic consumption we have assumed over each five-year period to 2040 in developed and developing countries as a result of implementing a plastic policy. These are multiplied by the probabilities given above, along with forecast plastic consumption, to calculate future plastic consumption at each five-year interval because of a policy intervention. Note that we have used low numbers through to 2030 assuming minimal change before 2025 as negotiations are progressing and then a minor change in the following five-year period. For a fuller explanation of these numbers please read the methodology in the Appendix.
Table 2: Policy Induced Reductions in Total Plastic Consumption
Under this scenario, developed countries will consume just over 10% more plastic per capita than developing nations in 2040. For developed countries to reduce per capita industrial plastic consumption below that of developing nations by 2040, a further 5% reduction is needed in relation to those mentioned in Table 2. However, this is only achieved in the late 2030s according to our modelling. Figure 1 clearly demonstrates why an effective global plastic treaty is needed promptly.
View the data and model used in this blog by using our interactive dashboard here.
The sad fact of the matter is that, even with policies implemented and achieving reductions in line with those outlined above, absolute plastic consumption will increase by 2.5x by 2040. This is mainly driven by increasing consumption in the developing world which Planet Tracker forecasts will witness an increase in absolute consumption of 3.1x compared to an increase of 0.3x in developed nations. The benefit that a global plastic policy intervention provides will be small in the early years, reducing plastic consumption by 1.3% versus the BAU trajectory by 2030, and by 6.0% by 2040.
In terms of reducing absolute values of plastic, rather than on a per capita basis, the benefit is more equitably spread between developed and developing nations, 22 million and 24 million tonnes respectively. However, in terms of percentage reductions, developed nations would need a 15% reduction versus a 4% reduction in developing ones. We encourage readers to use our interactive dashboard and enter their own scenarios to determine when developed and developing countries reach plastic consumption per capita equality.
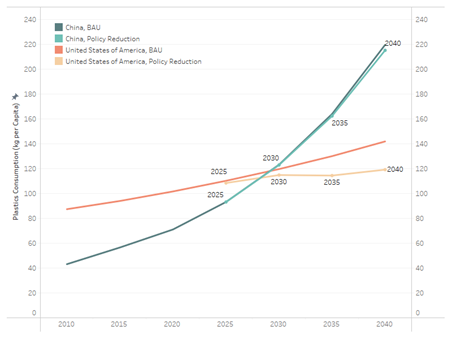
Figure 2: Industrial Plastic Consumption per Capita Forecasts – US vs. China.vi Source: Planet Tracker calculations – see methodology in Appendix.
In Figure 2, we show the two largest economies. This is also available on our dashboard. It reveals that China’s plastic consumption is currently one-third less than the United States on a per capita basis, despite showing a considerable upward trend in recent years. Indeed, given the rate at which China is increasing its plastic consumption, the gap may close with the United States by 2030, and by 2040 China may have per capita plastic consumption that is 1.5x higher than the US. Only with an additional 20% reduction on top of the values given in Table 2 will China consistently consume less than the US until 2040.
Watch this Space
There is momentum building for an international plastic treaty, but it’s far from a done deal. Presently, there is no consensus on how expansive a plastic treaty should be. Should it be limited to marine plastic pollution or address the complete supply chain? And how will existing plastic consumption levels affect subsequent negotiations – will developed countries be prepared to lower their consumption and will they be prepared to help finance a plastic transition to zero waste in the developing world?
The disturbing news is that even with a rapid scaling back of plastic consumption in the developed world it will take 20 years for developed countries to reduce per capita plastic consumption to equal that of the Global South.
View the data and model used in this blog by using our interactive dashboard here.
Appendix
Plastic Industrial Consumption Forecasts – Methodology
The data on industrial plastic consumption was sourced from Europe’s Association for plastics and rubber machinery manufacturers (EUROMAP),[viii] comprising 63 countries. EUROMAP provides reported figures for industrial plastic production from 2009 up to 2015, while estimating those from 2016 to 2020. In addition, we sourced population data from 2009 to 2020 from the IMF and forecast population data from the United Nations Department for Economics and Social Affairs.
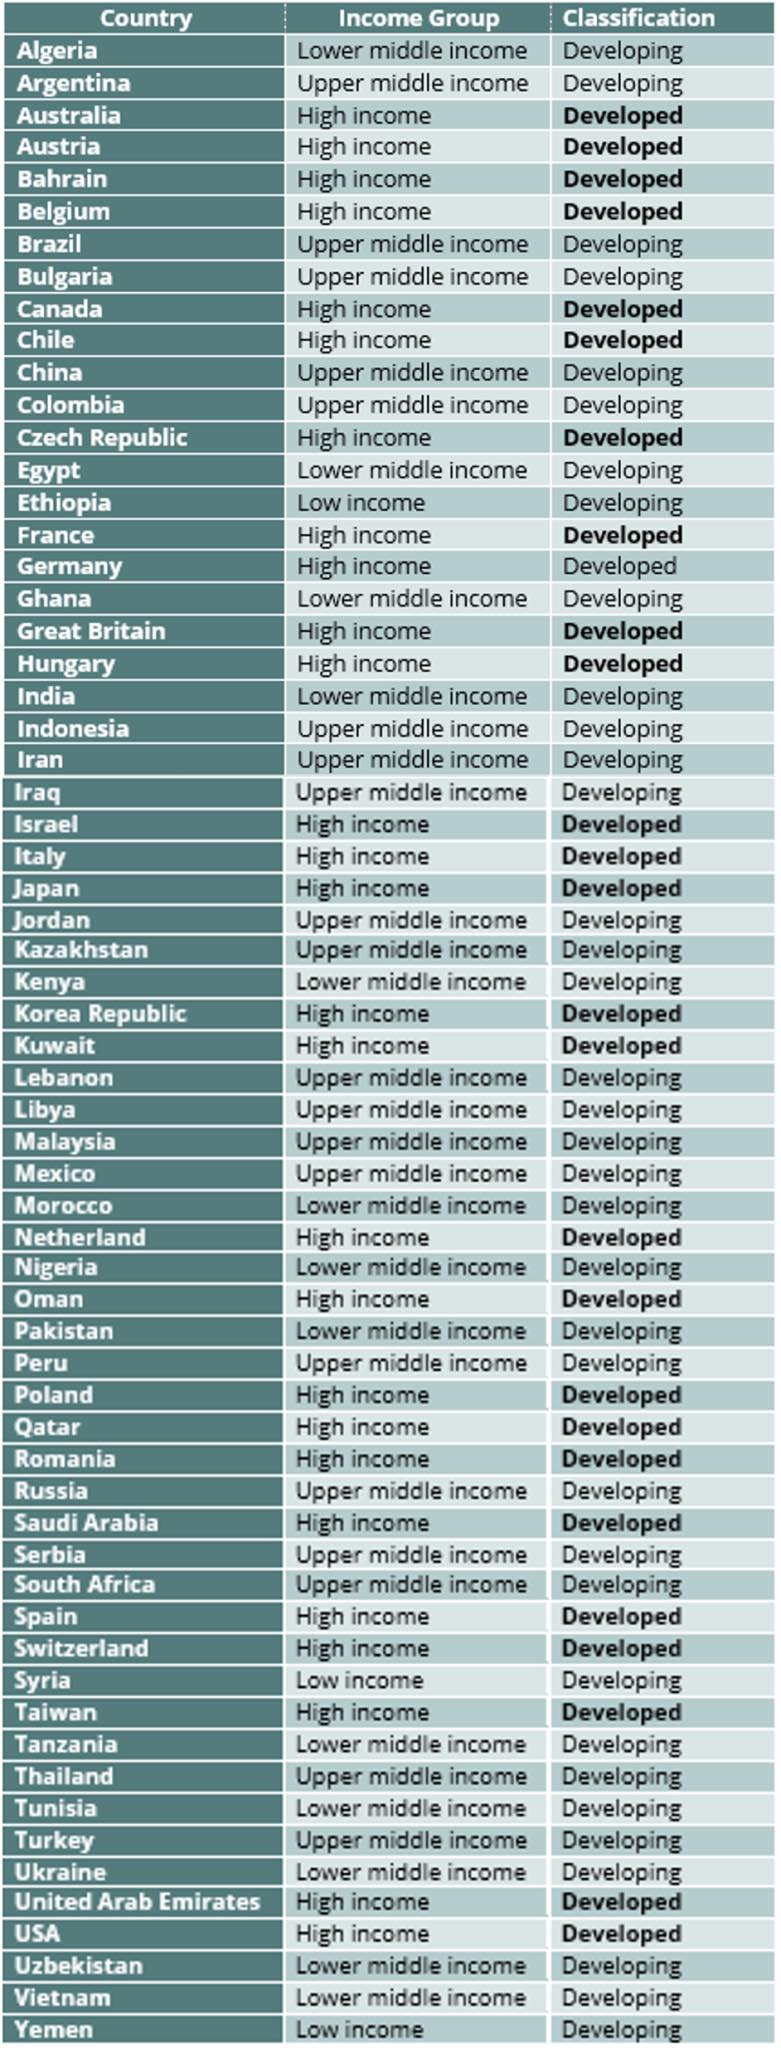
Planet Tracker assigned a binary classification to all countries in the sample, based on the World Bank’s income classification. Any country classified as High Income by the World Bank was added to the Developed World category, while all others were allocated to the Developing World classification. See Table 3 in the Appendix.
Planet Tracker used a Monte Carlo simulation to extrapolate the likely plastic industrial consumption growth until 2040. The historical time series for each country represented the starting point, with 100,000 simulations used to arrive to an average path for each country to 2040.
Acknowledging that it takes time to ratify international agreements, we have assumed that very little reduction in plastic consumption will be achieved before 2025. As these are voluntary accords, we still remain on the cautious side thereafter, as shown in Table 2. Here, we assign different plastic reduction goals for Developing and Developed countries.
Model Limitations
As every investor is frequently warned, historical returns are no guarantee of future ones. The same applies to the Monte Carlo simulation which is itself reliant on past consumption figures. These may well overstate consumption growth in developed markets in the future, especially in the case of areas such as the EU, which have seen progressive policy actions destined to curbing plastic production and consumption.
Also worth noting is that the consumption data gathered by EUROMAP relates to resin manufacturing and plastic processing industries, therefore measures the supply rather than demand for each country. Plastic consumption for the average citizen is hard to determine, nevertheless, the figures used should provide a reasonable approximation of the true values for each country. Notable exceptions are Belgium and Taiwan, both displaying very high numbers because of their high concentration of plastic usage in their industrial production relative to the size of their population.
Finally, we need to highlight that these consumption numbers do not consider waste treatment methods. For example, if a country is able to recycle all of the plastic it consumes, it could be fairly argued that the consumption level is of limited value when considering plastic pollution. Unfortunately, data on the treatment of plastic is notoriously difficult to gather as much of this is undertaken at a local level with poor data collection.
Policy-wise, it should also be noted that while policy actions may well be agreed upon, that does not automatically translate into implementation. Hence, the plastic consumption reduction parameters need to be taken purely in the context of what-if scenarios, which may or may not materialise. In such light, the assumed policy induced plastic consumption reductions which make up the BAU scenarios are highly susceptible of change and/or revision, depending on each country’s political condition. Readers are able to input their own assumptions here.
Table 3: Country Classifications
References
[1] The main industrial plastic consumption sectors are autos, construction, electronics and packaging – see Appendix for information on this classification.
[i] U.S. State Department (2021) Secretary Antony J. Blinken at an Ocean Plastics Event [Accessed on 09/12/2021] Available from [https://www.state.gov/secretary-antony-j-blinken-at-an-ocean-plastics-event/]
[ii] WWF (2021) Global Plastic Navigator. Worldwide Fund for Nature. [Accessed 09/12/2021] Available from [https://plasticnavigator.wwf.de/#/en/policy/?st=0&ch=0&layers=surface-concentration%7Cpolicy-commitments-area&info=policy-commitments-area]
[iii] UNEP (2021) Draft Resolution on an Internationally Legally Binding Instrument on Plastic Pollution. [Accessed on 09/12/2021] Available from [https://wedocs.unep.org/bitstream/handle/20.500.11822/36943/UNEA5.2%20Global_Agreement_Explanatory%20note%20and%20Resolution%2014%20October%20cosponsors_update%20v.2.pdf?sequence=1&isAllowed=y]
[iv] UNEP (2021) Draft Resolution on an Internal Legal Instrument on Marine Plastic Pollution to be Adopted by the Fifth Session of the United Nations Environment Assembly. [Accessed on 09/12/2021] Available from [https://wedocs.unep.org/bitstream/handle/20.500.11822/37272/Working%20Document%2c%20Draft%20Resolution_Japan%20for%208th%20Annual%20CPR%20subcommittee%20meeting.pdf?sequence=1&isAllowed=y]
[v]https://wedocs.unep.org/bitstream/handle/20.500.11822/36943/UNEA5.2%20Global_Agreement_Explanatory%20note%20and%20Resolution%2014%20October%20cosponsors_update%20v.2.pdf?sequence=1&isAllowed=y
[vi]https://wedocs.unep.org/bitstream/handle/20.500.11822/37272/Working%20Document%2c%20Draft%20Resolution_Japan%20for%208th%20Annual%20CPR%20subcommittee%20meeting.pdf?sequence=1&isAllowed=y]
[vii] Planet Tracker Analysis
[viii] EUROMAP (2021) Europe’s Association for Plastics and Rubber Machinery Manufacturers. Available from [https://www.euromap.org/]