The politics of food protectionism, nature dependency and hunger

Food and politics remain closely connected. Non-democratic countries are more likely to impose food export restrictions while the leading nature dependent exporters are resisting trade controls. Of the 23 global hunger hotspots, 22 are non-democratic*. However, politics is not the only force at play. Climate factors, speculation-prone grain markets and bio-fuels are also cited as reasons for rising food prices.
In an earlier report – ‘The Politics of Nature Dependent Trade’ – Planet Tracker examined the political regimes of the world’s main crops, whether sourced from democratic or non-democratic regimes.
In this follow-up blog and dashboard, we analyse the rise of protectionism associated with natural capital, with a focus on food commodities and whether politics and/or a sovereign’s nature dependency gives us an insight into further trade barriers. Also, we examine the political traits of those countries facing acute hunger.
*(Note: definitions of government types are taken from the Economist Intelligence Unit’s (EIU) 2021 Democracy Index – please see below for further explanation).1
Key takeaways:
- Food prices have risen dramatically and international concern is rising
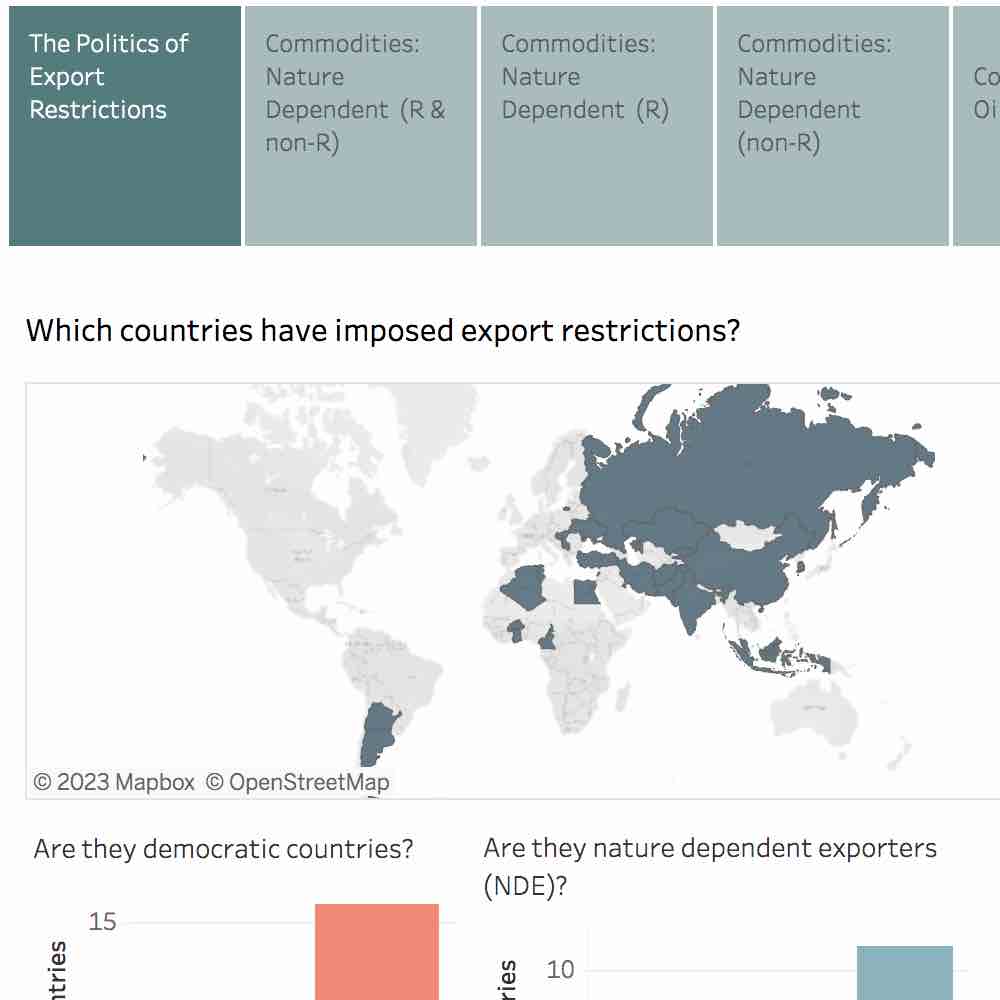
- Presently, 29 countries have imposed trade restrictions through bans, export licenses and/or export taxes
- Non-democratic countries (20 at present) have imposed more trade restrictions than democratic ones (9)
- The largest nature dependent exporters (NDEs) are less likely to impose export restrictions when compared to the smaller NDEs
- Twenty-three hunger hotspots most at risk of acute hunger comprise 22 non-democratic states
- But politics does not appear to be the only cause of rising food prices – climate change and a failure to learn from previous crises are also blamed
Please visit the dashboard on The Politics of Trade Restrictions
Higher and Higher?
Largely caused by supply chain disruption, food prices have risen dramatically. The International Panel of Experts on Sustainable Food Systems (IPES-Food) notes that the invasion of Ukraine has sparked ‘a third food price crisis in 15 years’. It adds that, ‘Food riots, civil unrest, and repressive government tactics seem likely’.2 It lays the blame for a recurrence of a food price crisis on four main factors:
- Food import dependencies – Global dietary diversity has been declining for decades (concentrated on wheat, rice and maize); cash crops have been promoted over more diverse food provision; some countries are now 100% dependent on imports of staple foods while being highly indebted
- Path dependencies in production systems – Geographical over-specialisation, trader and governmental preferences for commodity crops and biofuels, and reliance on synthetic fertilizers all hold back farmers’ ability to diversify food production and shift food production practices.
- Opaque, dysfunctional and speculation-prone grain markets – Global wheat stocks are currently high relative to historical trends and stock-to-use ratios are reasonable; what’s exacerbating price spikes is a lack of transparency on stocks, and what appears to be excessive commodity speculation.
- Vicious cycles of conflict, climate change, poverty and food insecurity – leaving hundreds of millions of people without the ability to adapt to sudden shocks3, 4
Figure 1 shows the real food price index – i.e. adjusted for the effect of inflation – as measured by the Food and Agriculture Organization (FAO).5 Although the May 2022 food price index was down 0.9% (0.6%) from the previous month, the second consecutive monthly decline, the index is 29.2 points (22.8%) above the corresponding month for last year.
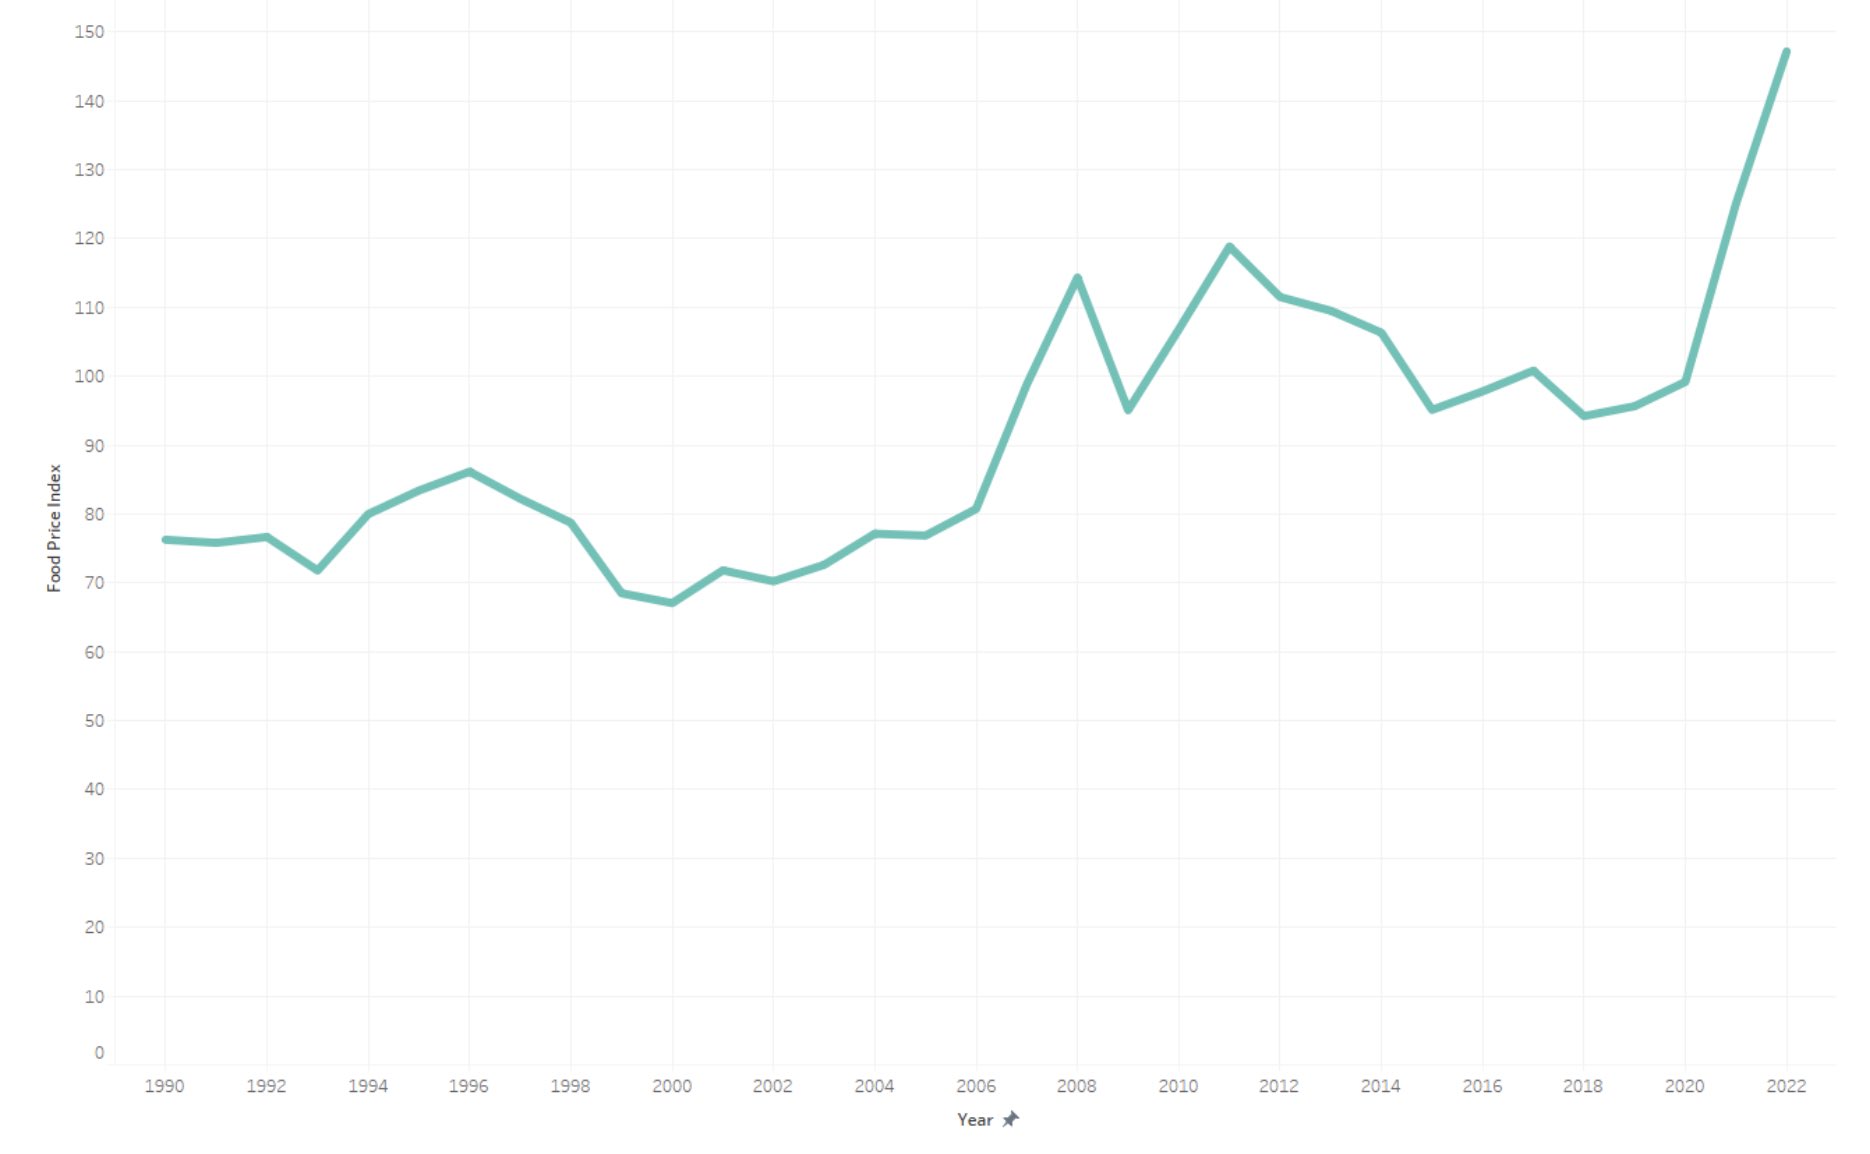
Figure 1: FAO Real Food Price Index
Source: FAO, Planet Tracker
This index masks the differences that are happening in the main food categories. In Figure 2 we show the real price indices for the major FAO food categories and note the significant climb in vegetable oil and cereal prices. Sugar and meat prices have been more subdued. The most recent FAO data to the end of May 2022, month-on-month, shows a further rise in cereal prices (+2.2%) and also meat prices (+0.5%), but declines in vegetable oil (-3.5%), dairy products (-3.5%) and sugar (-1.1%).
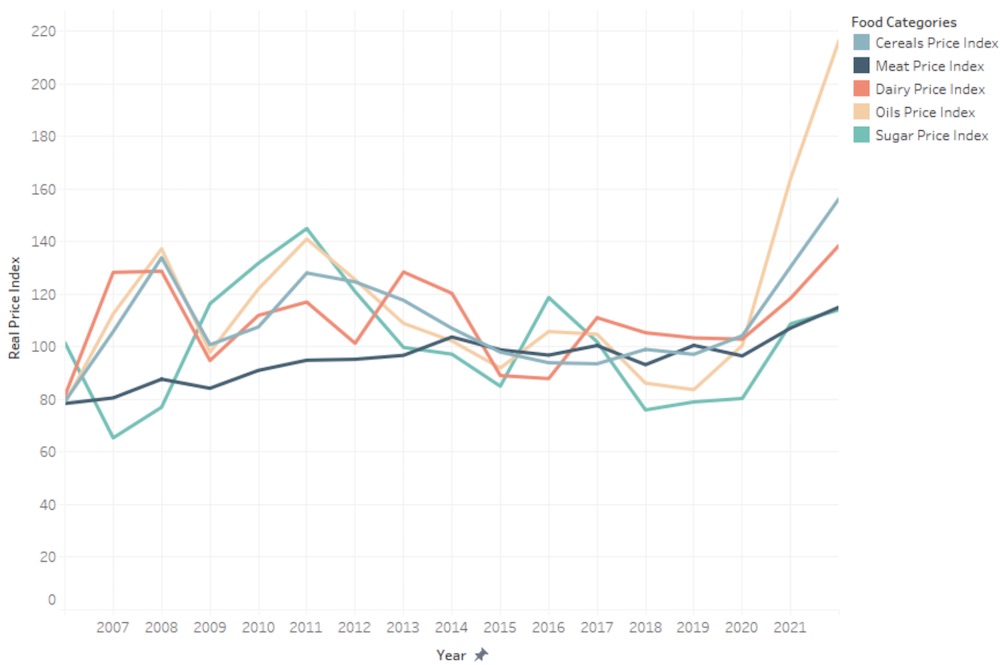
Figure 2: FAO Real Food Category Prices
Source: FAO, Planet Tracker
High on the Global Agenda
A number of intergovernmental bodies are demanding that countries reduce protectionist measures to keep trade open and free.
The United Nations’ Secretary General, Antonio Guterres, urged Governments, international financial institutions and other stakeholders to reduce the pressure on markets by increasing supplies of food and fertilizers. He affirmed that to face this emergency there should be no restrictions on exports and surpluses must be made available to those most in need.6 The UN also established the Global Crisis Response Group on Food, Energy and Finance in March 2022 to provide data and analysis and propose solutions.7 The Group immediately recommended that all food export restrictions should be lifted, strategic reserves should be released and surpluses allocated to countries in need.8
In May 2022, following the G7 meeting on Agriculture, the Foreign Ministers of Canada, France, Germany, Italy, Japan, the United Kingdom, the United States of America and the High Representative of the European Union committed to “mitigate the consequences of the current food crisis by avoiding signals and undue measures that restrict exports and lead to further increases in food and agricultural input prices, and […] to promote rules-based international trade for the mutual benefits of exporting and importing countries and by supporting innovations in the transport, storage and processing sector in order to increase resilience to future crises”.9 Furthermore, G7 Members affirmed that strengthening market transparency in this regard is key and they expect the 12th WTO Ministerial Conference (MC12) being held on 12-15 June 2022 to deliver on this issue.
The 12th WTO Ministerial Conference comes at a critical juncture. Ministers will have an opportunity to review the functioning of the multilateral trading system and to take action on the future work of the WTO. Among a variety of topics, discussions will cover fishing – see Planet Tracker’s ‘Subsidising Subsidies’ blog and WTO negotiation dashboard – food security and environment.10
Protectionism traits
This year, twenty-nine countries imposed food export restrictions. Data on the Food Security Portal, which is facilitated by the International Food Policy Research Institute IFPRI,11 shows that the number of countries adopting these protectionist measures is very similar to that seen in the food price crisis of 2008 but has moved higher than that seen at the height of the Covid-19 outbreak – see Figure 3.
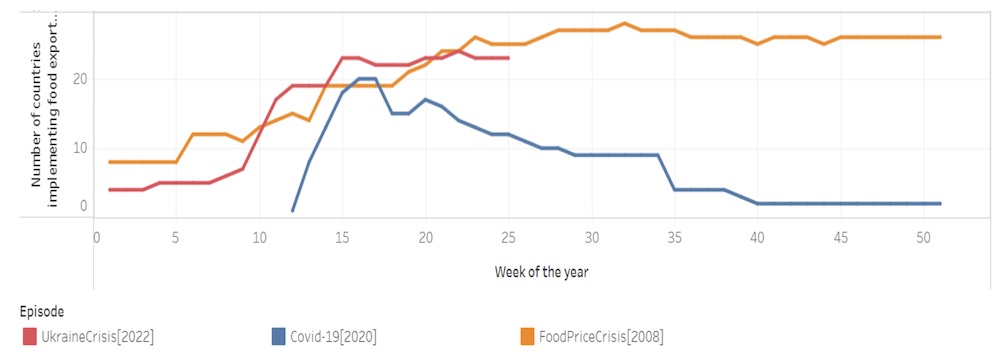
Figure 3: Number of countries implementing food export restrictions
Source: Food Security Portal
A large range of food types has been restricted – from pasta to potatoes – but dominated by palm oil and palm kernel oil, which accounts for 42% of restrictions as measured by value, while wheat, meslin, rye, barley, maize and sugar account for 23%. See Planet Tracker Dashboard on Food Trade Restrictions.
Bans are the most common type of trade restrictions (25 countries). Licensing trade restrictions have been implemented by 9 countries and taxes on exports by 3 countries. Note that some countries have implemented more than one type of trade restriction on the same product. When examining ban trade restrictions, across food products and fertilisers, non-democratic countries are nearly twice as likely to impose export constraints than democratic countries with a ratio of 16 to 9. Licensing trade restrictions show a similar bias: 7 non-democratic countries against 2 democratic countries.
If we categorise countries by their export dependency on nature-based products, identifying high, medium and low nature dependent exporters (NDE), we observe that countries with a low NDE are nearly twice as likely to adopt export trade restraints on food and fertilisers than high NDE countries. This may reflect the fact that high NDEs are much more reliant on food exports and do not wish to damage their economies.
The small sample sizes of the NDE groups makes political conclusions difficult to make with confidence.
The politics of food insecurity
The World Food Programme and the FAO have issued an alert for urgent humanitarian action in 23 hunger hotspots where hunger is expected to worsen from June to September 2022. The WFP-FAO defines hunger hotspots as countries or regional clusters where parts of the population are likely to face a significant deterioration of already high levels of acute food insecurity in the coming months that will put their lives and livelihoods high at risk.12
The report does not lay the blame for this humanitarian crisis solely on the Ukraine conflict, but also climate shocks. It warns that climate ‘will continue to drive acute hunger in the outlook period from June to September 2022 and we have entered a ‘new normal’ where frequent and recurring droughts, flooding, hurricanes and cyclones decimate farming, drive displacement and push millions to the brink in countries across the world’.13
Of the 23 hunger hotspots, 22 are non-democratic, as classified by the Economist Intelligence Unit’s (EIU) Democracy Index – see Figure 3.
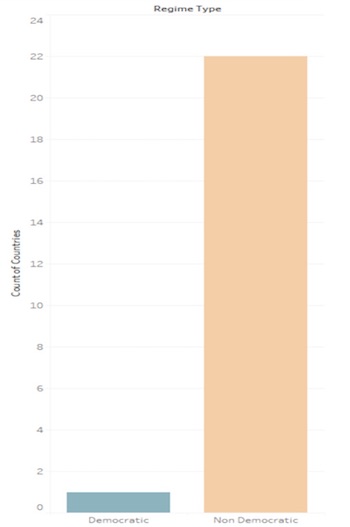
Figure 3: Food Insecurity Hotspot Countries by Political Type
Source: WFP and FAO, EIU, Planet Tracker
Ethiopia, Nigeria, South Sudan and Yemen remain at the highest alert level with Afghanistan and Somalia added to the list in the latest report. The single democratic country at risk is Cabo Verde. It imports 80 percent of its food and is extremely vulnerable to global food price increases. Furthermore, internal food production and livelihoods have been affected by five consecutive droughts.
Food and politics
Norman Borlaug, the winner of the 1970 Nobel Peace Prize Laureate,14 said ‘Food is the moral right of all who are born into this world’. Presently we are witnessing the availability of food being impacted by politics. We can observe a tendency for non-democratic regimes to be more willing to adopt protectionist trade policies, but also the overwhelming dominance of these regimes to account for the world’s hunger hotspots. No obvious political conclusions can be drawn among the high, medium and low NDEs due to the small sample size. However, a panel expert cautions against blaming everything on the Ukraine war and politics. WFP warn of continuing climate shocks while IPES-Food cites the failure to learn from the last two food crises.
Definitions and Methodology
Defining natural capital
Natural capital can be defined as the world’s stocks of natural assets which include geology, soil, air, water and all living things.15 It is from this natural capital that humans derive a wide range of services, often called ecosystem services, which make human life possible.
Natural capital can be divided into renewable sources – e.g. crops – and non-renewables – e.g. fossil fuels. In this note we focus on renewables although recognise that as far as the capital markets are concerned there is more financial value tied up in non-renewable sources. Between 2011 and 2020 (inclusive) the average annual value of nature dependent global exports, inflated to 2020 values in US Dollars, was USD 7.6 trillion, but was heavily weighted to non-renewables at USD 5.1trillion (67%).
Key renewable agricultural commodities
Planet Tracker has used the key agricultural commodities identified by the OECD-FAO in ‘Agriculture and food markets: Trends and prospects’ report.16 These are cereal, cotton, dairy, fish, meat, oilseed and sugar. Biofuels were excluded.
Trade data
Planet Tracker examined each country’s export data by using amended UN Comtrade goods categories, a repository of official international trade statistics,17 as provided by CEPII’s BACI dataset.18 We analysed this dataset and classified all exports into those dependent on nature, which included both renewable and non-renewable resources and those which were not.
Having calculated the dependency of a country’s exports to natural capital as the percentage of all exported goods, we split the dataset into three categories: high, medium and low dependence on natural capital exports.
For data on export restrictions on food products, Planet Tracker accessed the Food Security Portal which is facilitated by IFPRI. This data was accessed on 9 June 2022.19
Identifying the political systems
Planet Tracker has used the Economist Intelligence Unit’s (EIU) Democracy Index.20 It covers 165 independent states and two territories. The countries not covered in the EIU but covered by Comtrade were excluded from this analysis. Their share in total world exports is minimal. For the commodities presented in the dashboard, the largest share of world exports from such countries was for fish, at 3%.
The Democracy Index is based on five categories: electoral process and pluralism, functioning of government, political participation, political culture, and civil liberties. Based on scores on a range of indicators within these categories, each country is then classified as one of four types of regime:
- full democracy
- flawed democracy
- hybrid regime
- authoritarian regime
Planet Tracker has classified full democracy and flawed democracy as ‘democratic’ and hybrid regime and authoritarian as ‘non-democratic’.
1 The EIU Democracy Index 2020
2 IPES-Food Press Release 6 May 2022
3 ‘Another Perfect Storm?’, IPES-Food, May 2022
4 IPES-Food Press Release 6 May 2022
5 World Food Situation – FAO Food Price Index
6 UN Press Release 18 May 2022
7 UN Global Crisis Response Group
8 UN Press Release 19 May 2022
9 G7 Foreign Ministers Statement
10 Reuters – What could the WTO ministerial conference achieve?
11 The Food Security Portal
12 Hunger Hotspots FAO-WFP early warnings on acute food insecurity: June to September 2022 Outlook
13 Hunger Hotspots FAO-WFP early warnings on acute food insecurity: June to September 2022 Outlook
14 The Nobel Peace Prize 1970
15 The Natural Capital Forum
16 OECD-FAO Agricultural Outlook 2021-2030
17 UN Comtrade Database
18 CEPII – BACI Dataset
19 The Food Security Portal
20 The EIU Democracy Index