Will Asian AI ambitions be constrained by water resources?

The relentless expansion of AI requires ever more water. Processors, datacenters and often power, all need water. In this paper we focus on existing datacenters in Asia and reveal that the majority are located in areas of high water stress, which could affect their ongoing viability. AI cannot ignore nature’s boundaries forever.
Asia’s datacenters
Previously Planet Tracker warned that AI needs to be mindful of its water dependency by focusing on datacenters in the US. See AI needs to reduce its water dependency. This time we turn the spotlight on Asia, where the picture is more concerning. Table 1 shows that China, India and Japan are the three Asian countries with the highest number of datacenters. Please note that the number of mapped datacenters is lower than the total number of known datacenters, as coordinates are not available for all datacenters.
Table 1: Ranking of countries by number of datacenters
| Country | Number of datacenters |
| USA | 3,390 |
| Germany | 403 |
| UK | 378 |
| China | 328 |
| Canada | 254 |
| Australia | 249 |
| India | 248 |
| France | 243 |
| Netherlands | 188 |
| Japan | 169 |
Source: DataCenterMap1
AI needs water
AI requires water for three main reasons. Firstly, the production of AI processors (e.g. graphic processing units & tensor processing units) requires ultra-pure water for the cleaning of silicon wafers and the removal of contaminants during semiconductor fabrication. Secondly, considerable computing power causes heat generation in datacenters. To combat overheating, various cooling systems are used whether they be water-based, with water circulating through cooling systems, evaporative, which uses water to cool air, or hybrid, which combines the two. Thirdly, depending on the energy source, vast amounts of water are needed to produce the electricity required for running datacenters. This problem is compounded by the fact that most datacenters do not report on their water consumption, making water stress mitigation and water usage planning even more difficult.2
In this short paper we focus on datacenters in Asia. (See Figure 1.) This data is sourced from DataCenterMap, which has identified close to 9,000 datacenters. Of these, close to 8,500 have mapping coordinates, but there is no regulatory requirement to register datacenters in a central database, so all data are based on voluntary submissions and or collecting data from providers or other sources.
We used the baseline water stress indicator by the World Resources Institute (WRI) Aqueduct 4.0 Dataset3. Aqueduct 4.0 data was updated in August 2023. Water stress measures the ratio of total water demand to available renewable surface and groundwater supplies. Annual water stress is calculated by applying a weighted average of monthly values, with total demand as the weight; months with higher demand will have more influence on the annual stress value. Months with more demand reflect when the human need for water is greatest—it is also when socioeconomic dependency for water is most critical. The annual raw value is found by multiplying the monthly raw value by the monthly weight, summing, and dividing by the sum of the weights across the year. The risk thresholds fall into 5 categories from low to extremely high (Arid and low water use is treated separately).
Figure 1: Location of datacenters in Asia mapped against water stress
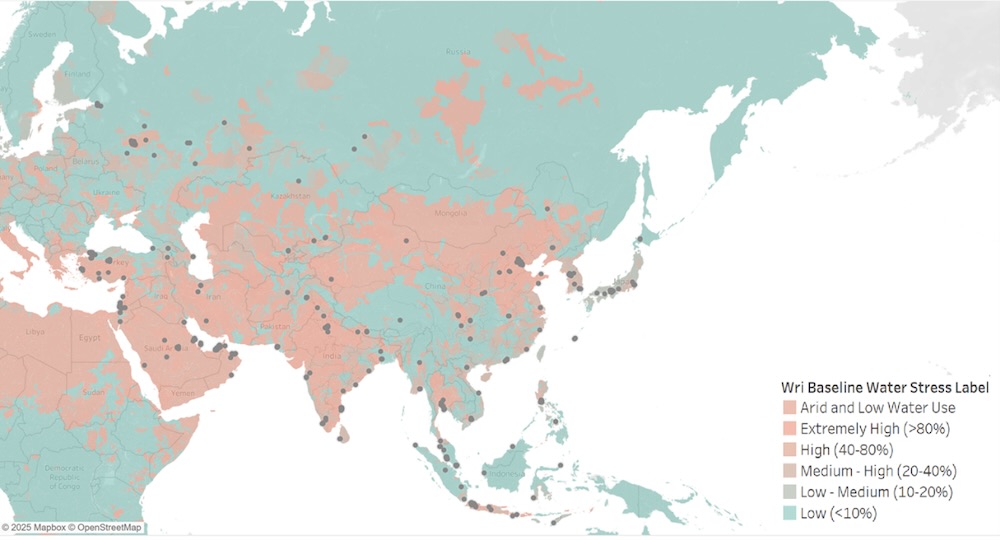
Source: DataCenterMap and World Resources Institute Aqueduct 4.0
The location of existing datacenters across Asia demonstrates a high exposure to water stress. With 41% located in areas of extremely high stress and a further 22% in high category, water needs to be given careful consideration when new datacenters are planned. Only 25% of datacenters are in water stress areas classified as low or low/medium.
Figure 2: Location of Asian datacenters by category of water stress
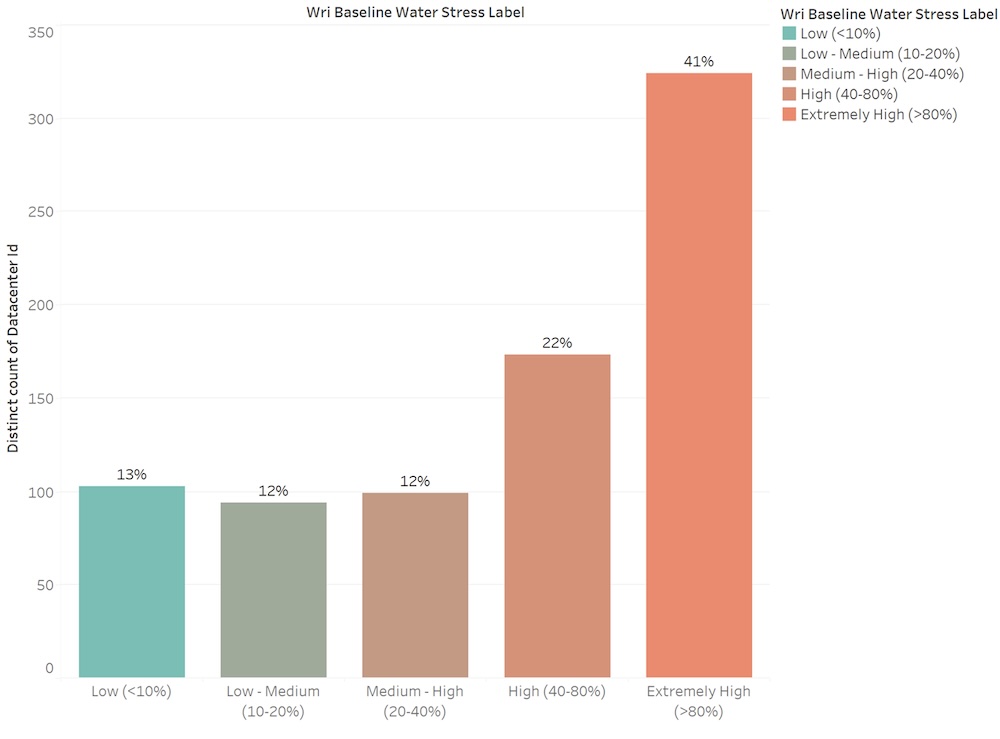
Source: DataCenterMap and World Resources Institute Aqueduct 4.0
The country view
Within Asia, the country with the largest number of datacenters for which geolocation was available at the time of writing was Indonesia, followed by India and Russia (See Figure 3). China is ranked fifth, just behind Turkey. Also note that this graph shows datacenters numbers, not their capacity. For example, often listed as the largest global datacenter by capacity is China Telecom’s Hohhot, Datacenter in China, in the Inner Mongolia Information Park, which covers 994,062 square meters.
Figure 3: Number and baseline water stress of geolocated datacenters ranked by Asian country
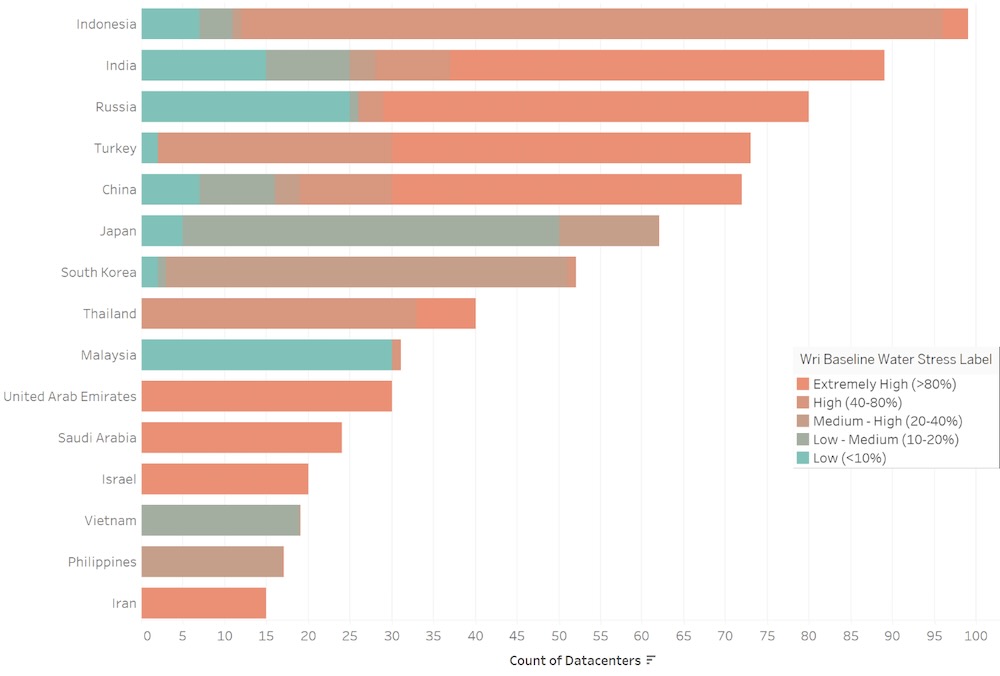
Source: DataCenterMap and World Resources Institute Aqueduct 4.0
Figure 3 reveals that four of the top five countries, ranked by number of datacenters, have a significant proportion in areas of extremely high water stress. Most of Indonesia’s datacenters are in areas of high water stress. It is worth noting that all of the datacenters in Iran, Israel, Saudi Arabia and the UAE, are in extremely high water stress areas. Malaysia, ranked 9th in Figure 2 has almost all datacenters located in areas of low water stress while Japan, ranked 6th, also looks more comfortable on water resources compared to its peers.
A report by China Water Risk highlighted that reporting of datacenters’ water consumption is often not sufficient. Limited disclosures show that Baidu and Xiaomi increased their water consumption in 2021 by 23% and 53%, respectively. Tencent saw water consumption increase by 31% in 2022. China Mobile, on the other hand, saw a 17% drop in water consumption.4
Looking ahead
Although there remains a lot of focus on the power needs of AI, water should not be forgotten. Water is needed from microchip production to datacenter cooling. And in many cases, rising energy demand may also need water. From a datacenter perspective, the five top Asian countries ranked by datacenter numbers, look highly vulnerable to water scarcity. Further datacenter expansion, which looks inevitable, needs to ensure local water needs are properly evaluated. And if financial markets believe they are insulated from this exposure, investors and lenders should recall instances when Taiwan’s semiconductor industry was impacted by droughts in 2002, 2015 and 2021. Not only were share prices and chip prices affected, but local decisions had to balance industry’s water demands against those of farmers.
1 DataCenterMap.com, Accessed 2 March 2025.
2 D. Mytton (2021) Data Center Water Consumption, npj Nature.
3 World Resources Institute (2023), Aqueduct 4.0 Global Map.
4 China Water Risk (2024) China ICT running dry?