Valuing the global food system

Planet Tracker has created an interactive dashboard to enable users to value the global food system by adjusting various valuation variables.
Planet Tracker defines the food system as commencing with input providers (e.g. agricultural chemicals and machinery) through to producers and traders, food & beverage manufacturers and distributors, and ending with the retailers, food service and waste companies – see Figure 1. Some could view the global food system as even larger, if suppliers to this industry, such as packagers or service providers, are included.
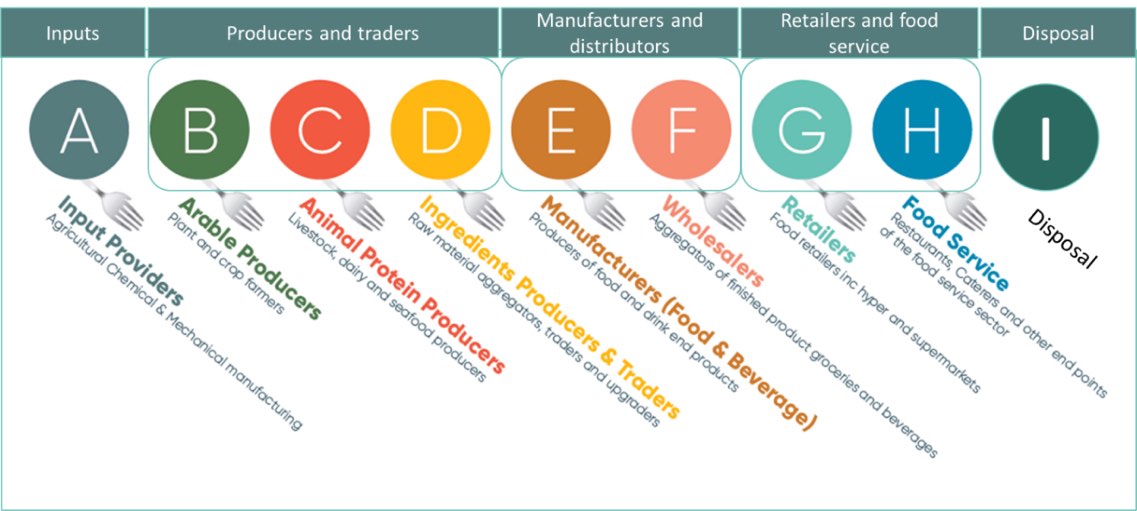
Figure 1: The global food system – node analysis (Source: Planet Tracker)
Valuing the global food system is a challenging task and involved the analysis of 400,000 companies connected to food. Planet Tracker was unable to gather accurate numbers on hundreds of millions of smallholder farmers or tens of millions of artisanal fishing and small aquaculture businesses. Moreover, further down the supply chain, our database does not include smaller food manufacturers and retailers.
Planet Tracker estimated the enterprise value of the global food system to be around USD 14 trillion with revenues in the region of USD 15 to 19 trillion. This is equivalent to between 16 and 20% of GDP. It’s noteworthy that up to 70% of revenues come from 0.06% of all companies. For further details please see ‘How much is your food worth?’.
We recognise that we have provided a significant revenue range – although even at the lowest value in the range it clearly demonstrates the economic importance of the food system – and that we have had to make various assumptions.
For example, how many small- and medium-sized enterprises (SMEs) are there and what revenue multiples should be applied to them?
In the Planet Tracker Valuing the Food system dashboard, the user is able to adjust various valuation variables. We provide two main valuation approaches: Scenario 1 (S1) based on the number of businesses and Scenario 2 (S2) based on the protein price (both discussed in more detail in ‘How much is your food worth?’).
S1 uses a number of businesses approach. The aggregate revenue figure from the Planet Tracker food system database is used and then revenues are estimated for non-farm businesses (based on the number of businesses and a revenue multiplier compared to the assumed average smallholder revenue). This is added to the estimated smallholder revenue (510 million smallholders times an assumed average per farm) and these figures are added to the Planet Tracker database figure to calculate the overall revenue number.
S2 is based on protein prices. This model uses daily per person protein consumption levels, for both animal and plant proteins, combined with the price of this protein. The consumption data only relate to food sold through food retail and food service outlets so the revenue number must then be grossed up to provide a system-wide estimate (based on the assumed proportion of revenues coming from this part of the food system). Finally, the user can adjust for the global population.
In both instances, for the non-quoted companies, both large and small, a valuation discount may be applied. The displayed values will show the estimated revenue, equity and enterprise values.
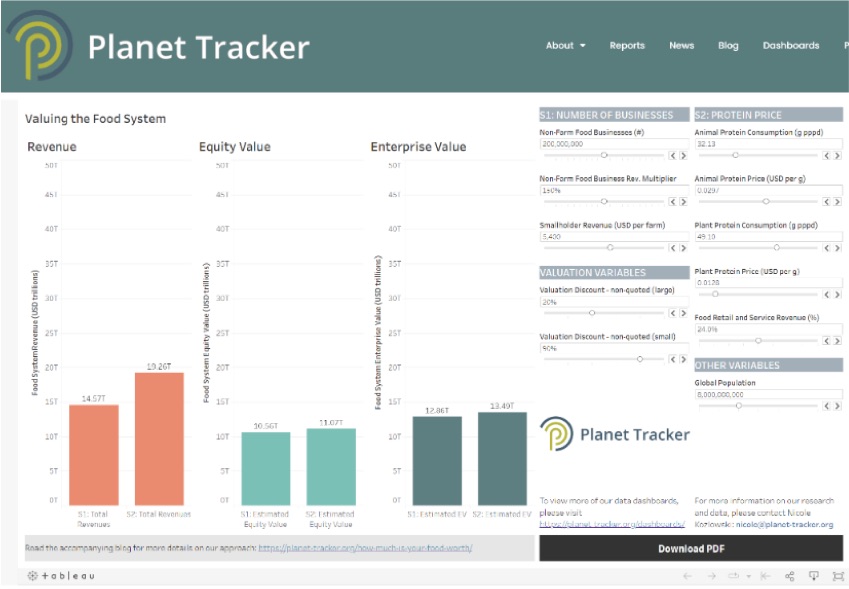
Figure 2: Valuing the Food System Dashboard (Source: Planet Tracker)