Stressing about water footprints

“Water is the driving force of all nature.” — Leonardo da Vinci
Food and water security have been in the headlines in the last year. We examine how much water major food products require and expose this hidden trade network. The likes of beef, cocoa and coffee soak up the water; sugar, fodder and vegetables are more sparing. The top three exporters of food products ranked by their water footprint are Brazil, USA and India, while for importers it is China (by a long way), USA and the Netherlands. Concerning, are the trading nations which are also water stressed. India’s cereal exports look exposed.
The World meets on water
Marking the halfway point of the UN Decade for Action Water for Sustainable Development (2018 – 2028), the United Nations (UN) 2023 Water Conference will take place at UN Headquarters in New York from 22 to 24 March 2023. It is the first UN Conference that strictly focuses on water since 1977 and builds on the momentum generated by frameworks such as the Paris Agreement and the Global Biodiversity Framework. Its goal is to accelerate water action to improve availability and sustainable management of water and sanitation for all (SDG 6). Governments and stakeholders will discuss about valuing water, water-energy-food nexus and climate resilience.1
Water Footprint definitions
- Green water is water from precipitation that is stored in the root zone of the soil and evaporated, transpired, or incorporated by plants. It is particularly relevant for agricultural, horticultural and forestry products.
- Blue water is water that has been sourced from surface or groundwater resources and is either evaporated, incorporated into a product or taken from one body of water and returned to another, or returned at a different time. Irrigated agriculture, industry and domestic water use can each have a blue water footprint.
- Grey water is the amount of fresh water required to assimilate pollutants to meet specific water quality standards. The grey water footprint considers point-source pollution discharged to a freshwater resource directly through a pipe or indirectly through runoff or leaching from the soil, impervious surfaces, or other diffuse sources. Note that for crops, the grey water footprint only includes the water needed to mitigate the impact of nitrogen pollution.2
The water footprint of food products
Commonly traded food products consume vastly different amounts of water. For example, cocoa beans consume 100 times as much total water as sugar crops. Beef, the most water intensive animal derived product, consumes about 3 to 4 times more than chicken or pork. The largest user of blue water – sourced from surface or groundwater – are nuts which require 1,367 m3/ton, while roots and tubers, such as beets, carrots, potatoes and yams, typically need only 16 m3/ton. Grey water, which gives an indication of nonpoint source pollution levels caused by fertilizer application, is highest for tea and pulses – e.g. beans, lentils, chickpeas and split peas – and least for fodder and sugar crops. Table 1 below shows the average green, blue and grey water footprint of the primary food categories.3,4
Table 1. Water footprint of food products
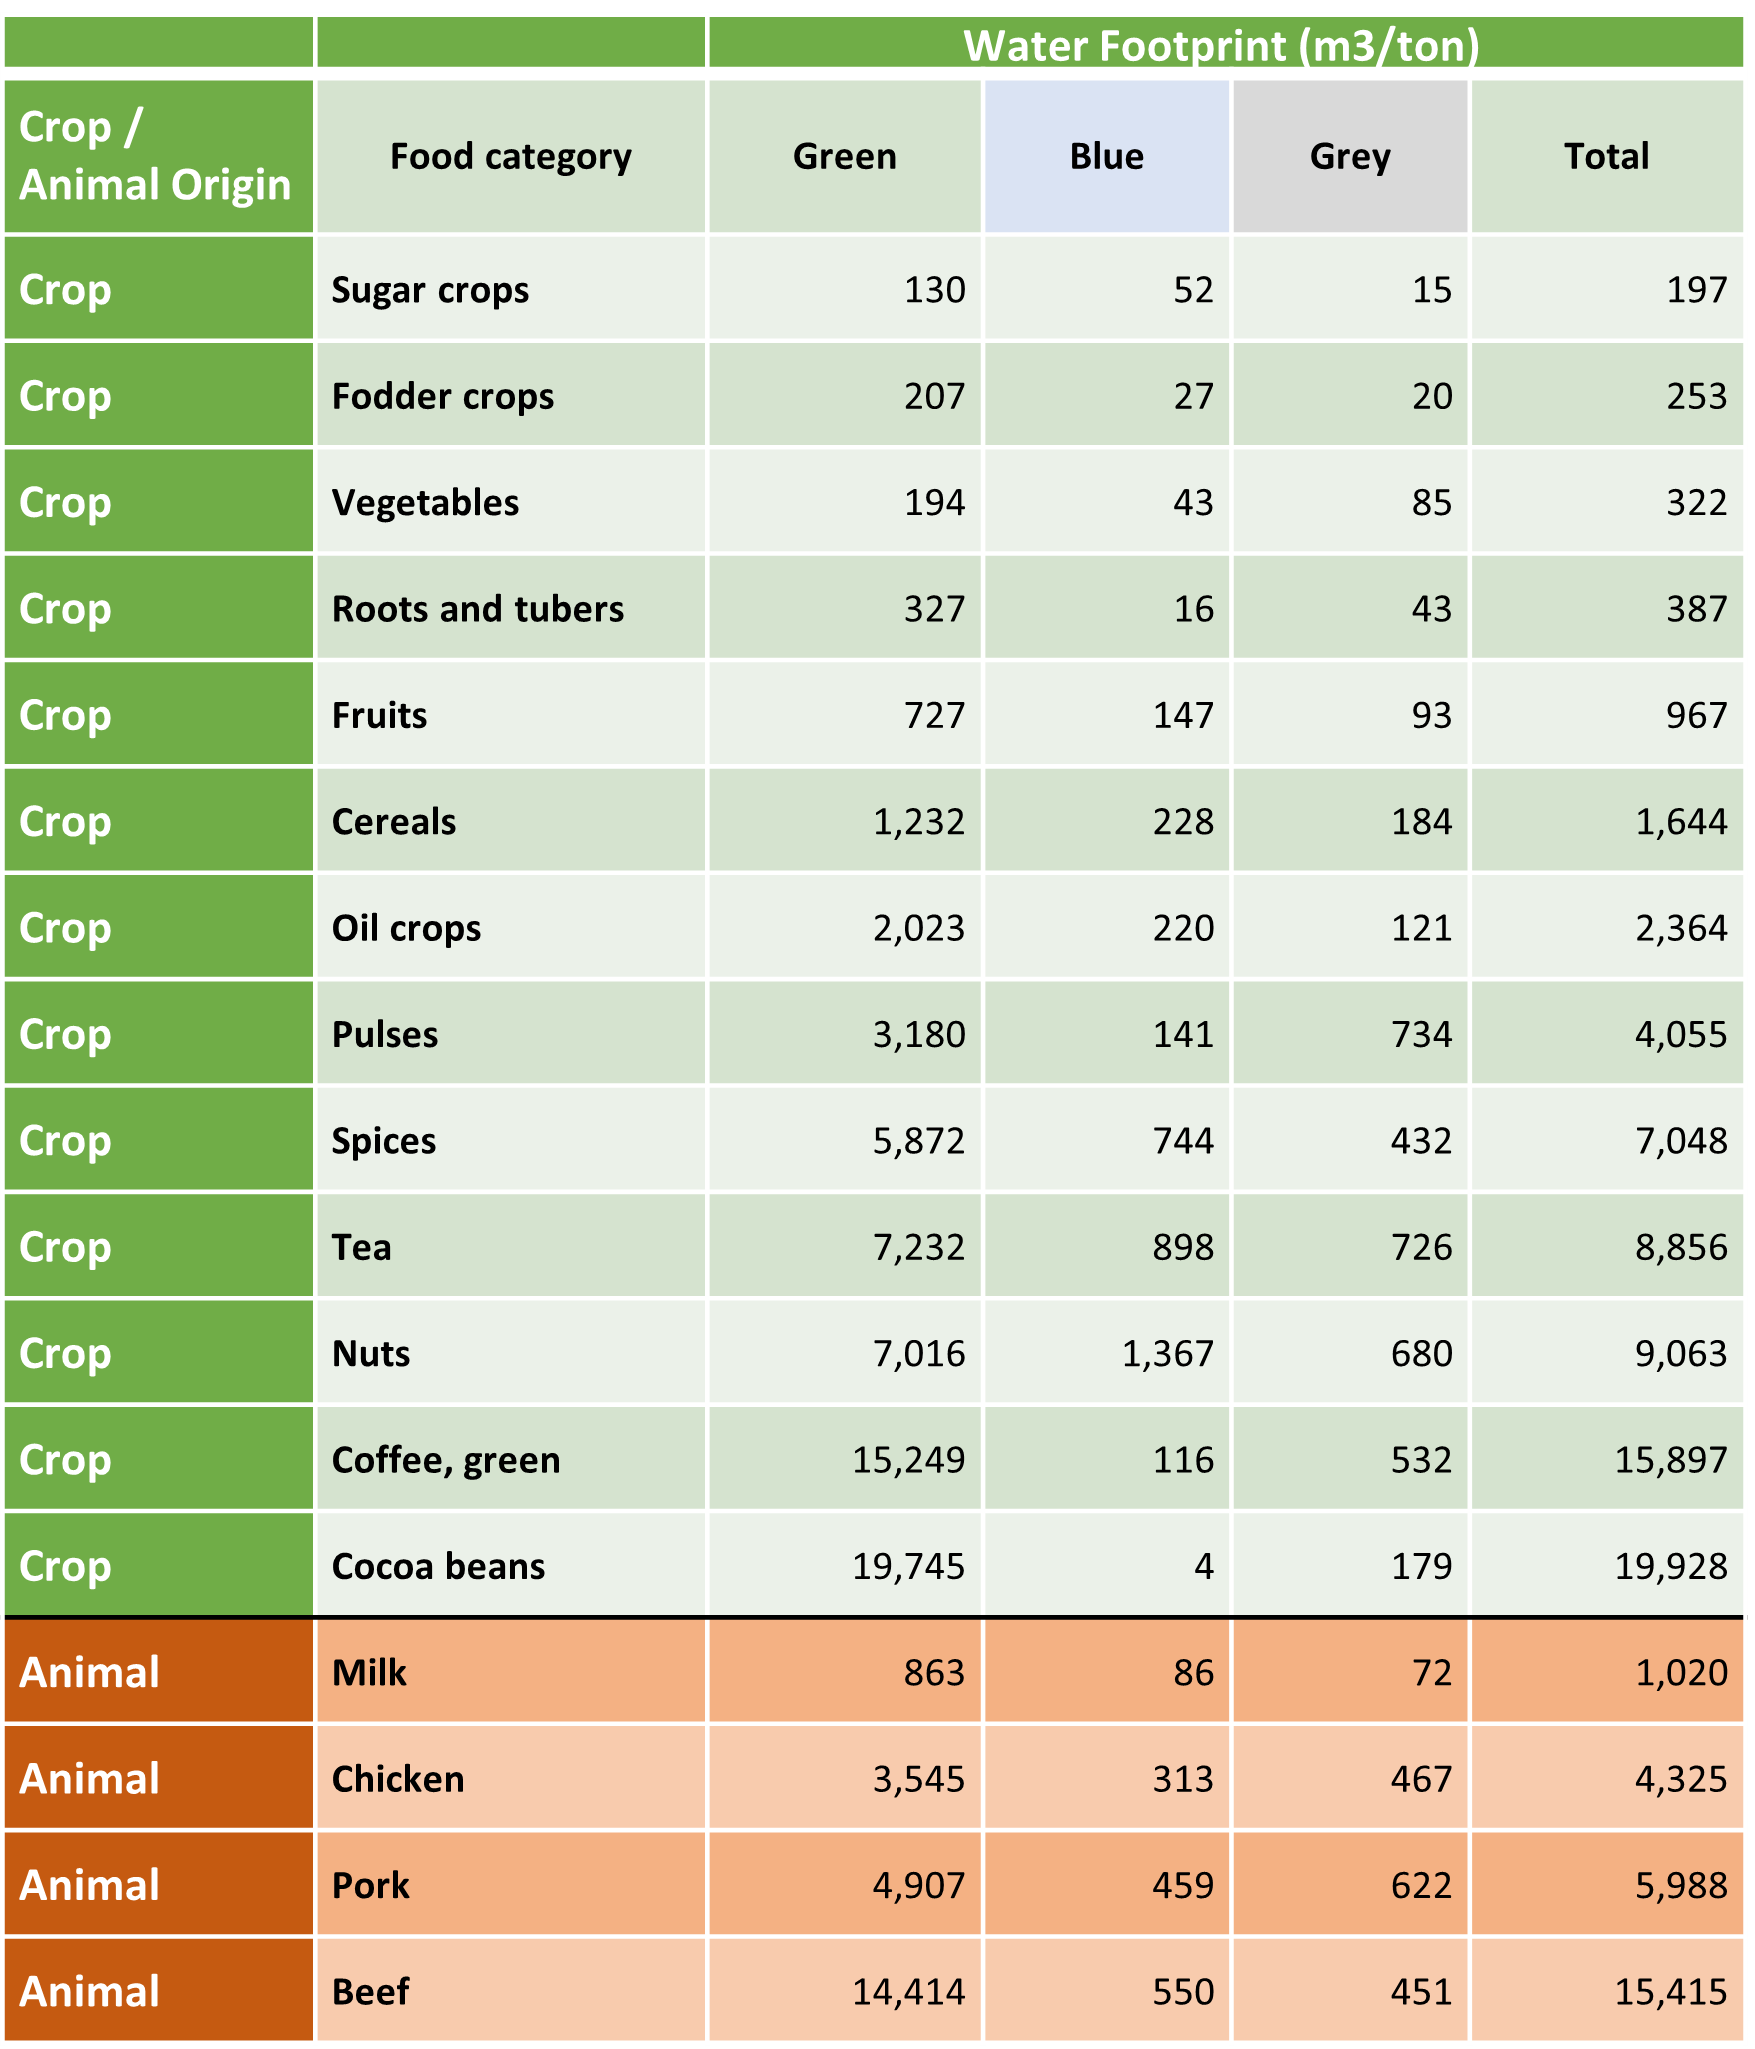
Source: Mekonnen and Hoekstra, 2010. Mekonnen and Hoekstra, 2012.
Trading food
Planet Tracker analysed the trading tonnage of these food products and calculated the embedded water using the data from Table 1. Note that the water footprint of each food category is fixed in a single value (the average of the 1996-2005 period, which is the dataset used for the Mekonnen and Hoekstra, 2010 and 2012 papers), and is applied for all the historic trade data. As the proportion of major food types has not changed dramatically between 1995 and 2021, exports of major food products and the implied water footprint have largely moved in tandem – see Figure 1. Planet Tracker calculated the growth rate of the global water footprint of these food products. The water footprint demonstrated a CAGR of 1.0% over the last 5 years (2017-2021), 2.9% in the last 10 years, and 4.1% since 1995. Based on traded volumes, the CAGR was respectively, 1.0%, 3.1% and 3.6%.
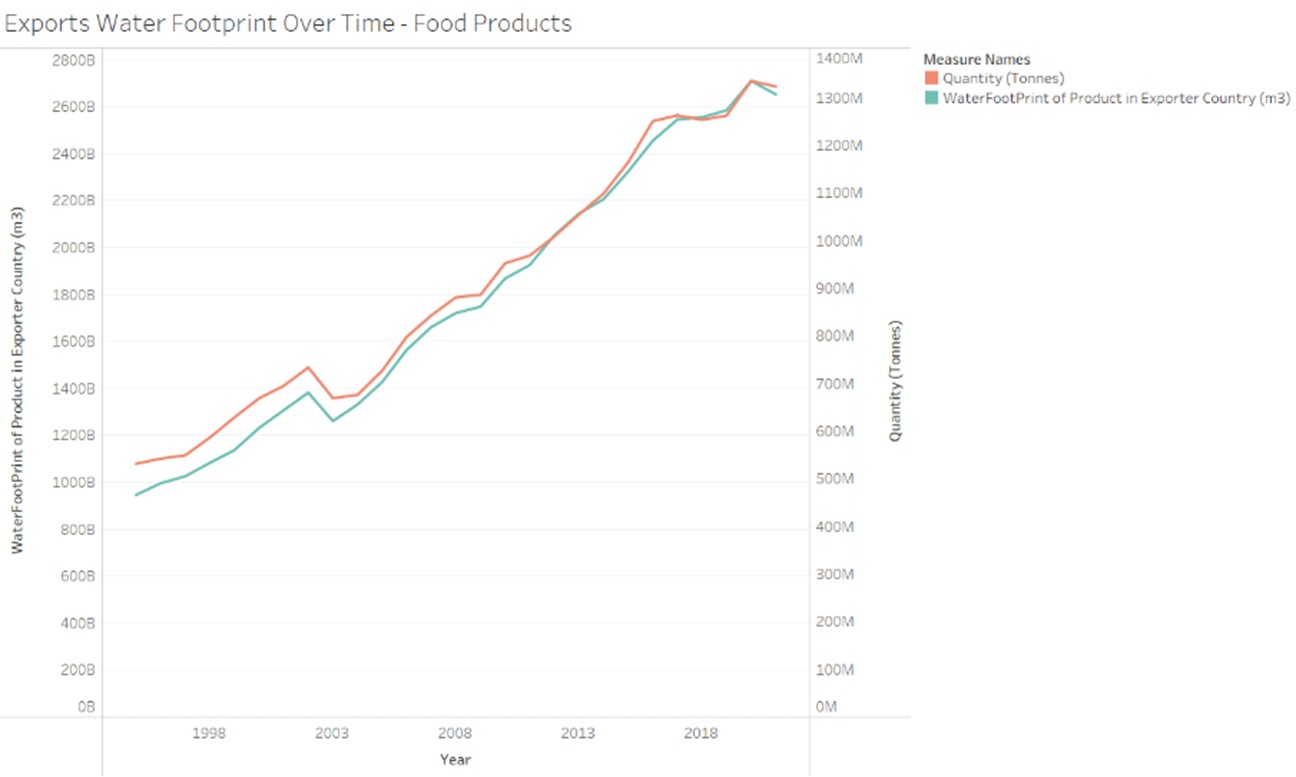
Figure 1. World exports of food products: Quantity and water footprint in exporter country. 1995-2021
Source: Mekonnen and Hoekstra (2010 and 2012), CEPII BACI (2023), Planet Tracker
Major exporters of food and water
Planet Tracker used the BACI dataset from CEPII,5 which reconciles the UN COMTRADE dataset on international trade,6 and matched it to water footprint data for each crop type and animal product. We then grouped these food products into six main categories: seed & vegetable oils (which includes soybeans), cereals, meat & animal products, coffee, tea & spices, cocoa and others.
Note that the following charts show the quantity and water footprint of the products that were traded internationally, which is less than the total amount produced, since it excludes products produced for domestic consumption. Also note that we include derived products to some extent. For example, within the cereal category we include products like wheat, bread and pasta made of wheat. Finally, since meat’s water footprint includes supply chain water, for example the fodder crops that feed the animals, some amount of double counting is inevitable. Meat and animal products include milk, eggs and similar products.
The countries with the largest water footprint of exported food products in 2021 were Brazil, USA, India, Indonesia and Argentina – see Figure 2.
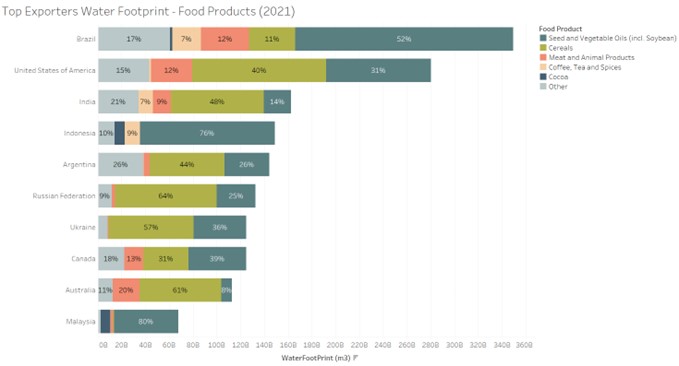
Figure 2. Top Exporters by Water Footprint of Food Products. 2021
Source: Mekonnen and Hoekstra (2010 and 2012), CEPII BACI (2023), Planet Tracker
Major importers of food and water
In 2021, the countries with the largest water footprint of imported food products – the footprint is calculated in the country’s product of origin – were China, USA, Netherlands, Japan, Germany. Nearly 60% of China’s implied water imports were from the seeds & vegetable oils category, but this was a lower proportion than India’s 77%, although in volume terms of imported water footprint, China is 4 times larger than India. When examining the water footprint associated with cereals, Egypt is the most exposed as a proportion of total imports (65%), followed by Mexico (38%) and Japan (34%) – see Figure 3.
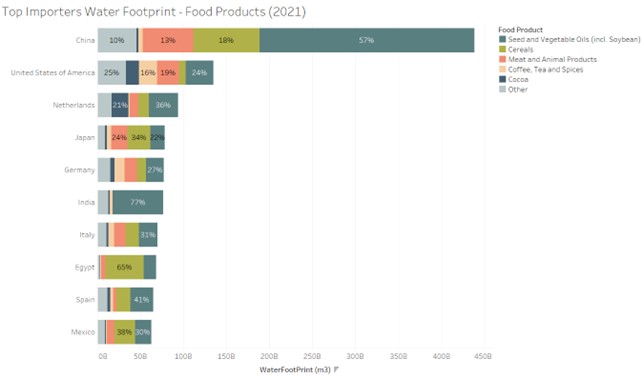
Figure 3. Top Importers by Water Footprint of Food Products. 2021
Source: Mekonnen and Hoekstra (2010 and 2012), CEPII BACI (2023), Planet Tracker
The increase in China’s water footprint for imports of food products has been particularly dramatic. In Figure 4, we show the top 3 importers over time. Back in the mid-2000s, these top three importers all had similar water footprints. However, by 2021, China’s water footprint was 438 m3 billion while the USA was 135 m3 billion, less than one-third of the former’s. The Netherlands imported water footprint for foods was the third largest at 94 m3 billion.
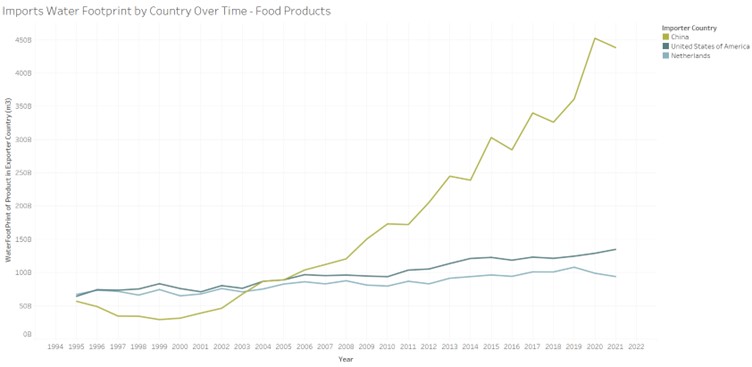
Figure 4. Top 3 Importers by Water Footprint of Food Products. 1995-2021 in billions of m3
Source: Mekonnen and Hoekstra (2010 and 2012), CEPII BACI (2023), Planet Tracker
Stressed about water
We overlaid data from Aqueduct – Baseline Water Stress Scores7 – see Figure 5 – with crop production data from the Spatial Production Allocation Model (SPAM)8 to calculate how much of each crop in each country is produced in water stressed areas. Baseline Water Stress measures total annual water withdrawals (municipal, industrial, and agricultural) expressed as a percent of the total annual available flow. Higher values indicate more competition among users. The score represents present water stress levels.
Figure 5 shows the Baseline Water Stress dataset which we used as an input for our calculations. Among the major food traders, water stress is evident in much of the USA, India as well as eastern & western China.

Figure 5. World Resources Institute Aqueduct Baseline Water Stress categories (BWS)
If we focus on the two major crop categories, cereals and seeds & vegetable oils, Figure 6 shows the total quantity exported, the associated water footprint and the average baseline water stress score of where that crop is produced. Data is shown for the top three countries taken from Figure 2.
We can conclude that for both the USA and India, a significant amount of both crop types are produced in areas that are highly water stressed. For the USA this problem is compounded by the fact that these crops also have a large water footprint.
On the other hand, in Brazil, even with soybean production’s high water footprint, which is included in the seeds & vegetable oils category, the water stress score suggests there is no immediate cause for alarm. However, it is important to note that this data is aggregated at the country level and we note that regional changes are becoming evident. Please see ‘No Rain on the Plain’ and ‘Destroying Brazil’s AirCon’. Please contact us directly if you are interested in finding out which areas in these countries are not only highly water stressed, but also produce large amounts of crops. Furthermore, for a more detailed analysis of the dependencies on sovereigns which rely on crops, please see ‘Nature Dependent Exporters’ and its dashboard.
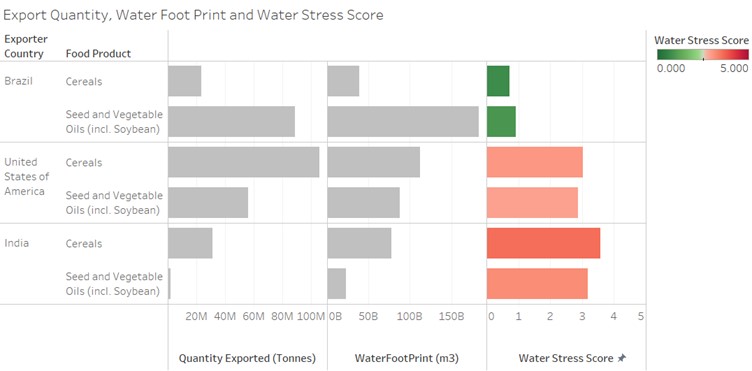
Figure 6. Exports, water footprint and water stress scores for two main crop types
In Figure 7, we show the total quantity of imported food type, along with their associated water footprint and the average present baseline water stress score of where that crop is produced. Data is shown for the top 3 food importers taken from Figure 3. Notable is that the average water stress scores in the country of origin for these imported goods, is much lower than that for the major exporters as shown in Figure 6. However, the calculations are based on present water stress levels, not predicted ones.
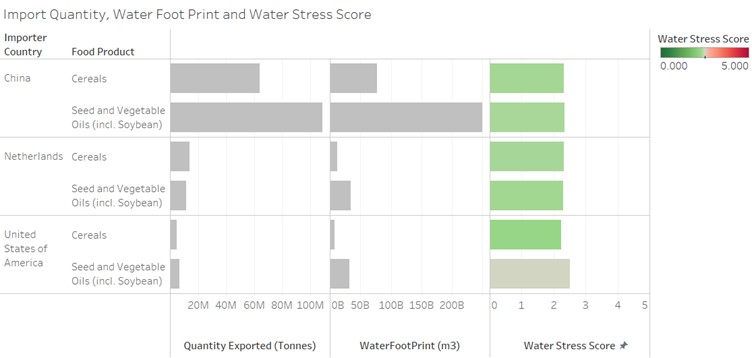
Figure 7. Imports, water footprint and water stress scores for two main crop types
Disappearing water
Crops require different amounts of water. Climate change raises concerns about those which have a larger water footprint – nuts typically need more than 9 times the water footprint of fruits. The world’s largest importers and exporters of these crops need to be particularly mindful of such issues. This is not just an economic matter but a humanitarian one as well. Two of the top three food exporters are facing water stress in major crop categories such as cereals and seeds & vegetable oils. China is the world’s largest food importer by a long way, being 3 times greater than a second-placed USA. Food security issues and the associated water risk, are not going away.
References
1 UN 2023 Water Conference 22-24 Mar 2023, New York Accessed 05/03/2023.
2 Water Footprint Network (2023) What is a water footprint? Accessed 02/03/2023.
3 Mekonnen and Hoekstra. (2010) The green, blue and grey water footprint of crops and derived crop products Volume 1: Main Report Accessed 02/03/2023
4 Mekonnen and Hoekstra. (2012) A Global Assessment of the Water Footprint of Farm Animal Products Accessed 02/03/2023.
5 CEPII (2023) BACI dataset Accessed 02/03/2023
6 UN COMTRADE Database Accessed 02/03/2023
7 World Resources Institute (2015) Aqueduct Baseline Water Stress Accessed 06/03/2023.
8 International Food Policy Research Institute (2019) Global Spatially-Disaggregated Crop Production Statistics Data for 2010 Version 2.0 Harvard Dataverse, V4 Accessed 02/03/2023