How much is your food worth?

Valuing the global food system is challenging. Planet Tracker has set out to do this by analysing 400,000 companies connected to food. We estimate the asset value of the system is c. USD 14 trillion, with revenues in the region of USD 15 to 19 trillion (equivalent to c. 20% of global GDP). This is how we did it.
Valuing the global food system
Valuations usually depend on applying a multiple to profits or forecasting future cash flows and applying a discount to them to work out today’s value.
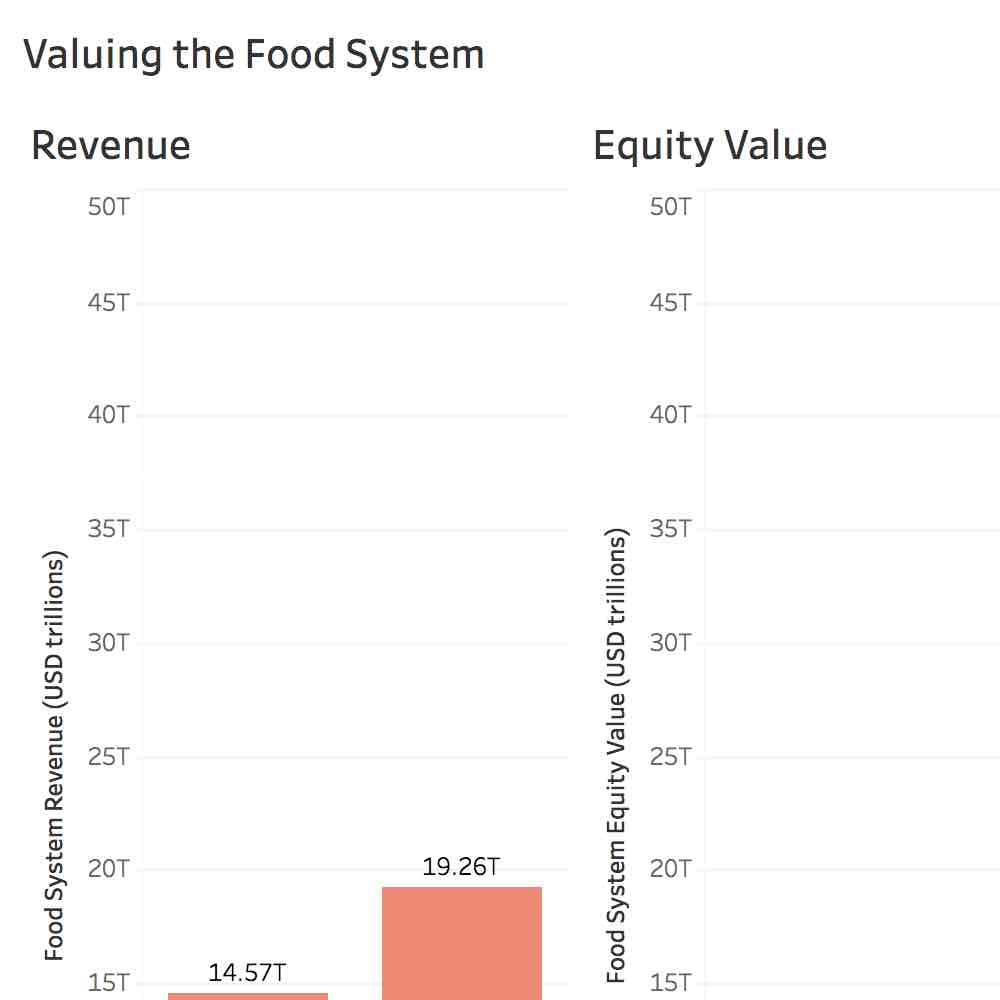
Neither of these methods are possible based on the data available from companies connected to the food system, so we’ve taken a simpler approach and applied a multiple to revenues – see Figure 1.
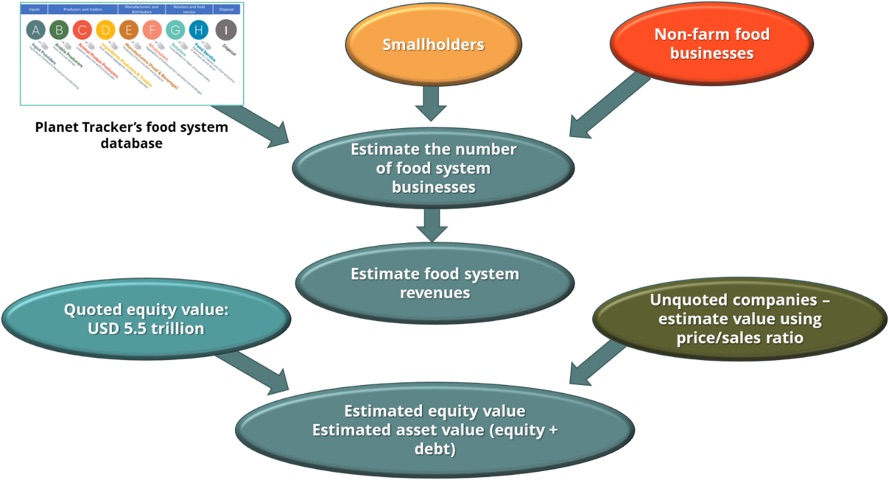
Figure 1: Valuing the food system (source: Planet Tracker)
But first we had to estimate revenues.
Estimating global food system revenues
Planet Tracker’s food system database captures revenues of USD 10.2 trillion
We have collated a database of 400,000 companies connected to the food system and estimated the revenues that they produce that relate to food system activities.
Figure 2 shows how we analyse the food system.
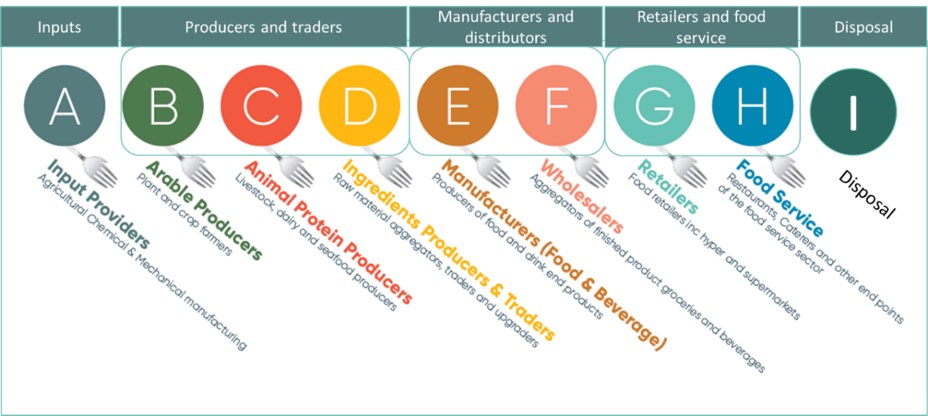
Figure 2: The global food system (node analysis) (Source: Planet Tracker)
The total revenues in our database relating to the food system amount to USD 10.2 trillion. This is a large number – enough to pay off the external debts of the UK and Belgium in a single year,1 but it’s not the full picture.
There could be a billion businesses outside our database
We know our database does not cover all the businesses involved in the global food system because it only covers the 400,000 largest companies.
Lowder et al (2021) estimates that there are 510 million smallholder farmers2 and they don’t count the tens of millions of artisanal fishing and small aquaculture businesses. None of these currently feature in our database, nor do the millions of other smaller food-related businesses further down the supply chains (small food manufacturers, retailers and food service companies). If we assume the number of non-farm businesses is slightly lower than the number of smallholders a rough estimate of the total number of businesses might be one billion.
However, this seems high in the context of various estimates of the number of SMEs (Small and Medium-sized Enterprises) globally which tend to be around 400 million (and estimated to constitute as much as 99% of businesses by number). Since not all of these will be food businesses it seems reasonable to assume a lower number of non-farm food businesses to add to the 510 million smallholders.
Data from the EU shows there were c. 13 million food businesses employing 29 million workers3 in 2019. The number of farms in the EU in 2019 was 9.1 million implying 4 million non-farm food-related businesses, 15% of the total business population (25.9 million in 2019).4
Applying this proportion (15%) to the estimated global number of businesses (400 million) would imply 61 million non-farm food-related businesses worldwide.
However, this sample is not representative of the Global South, so an alternative approach using World Bank estimates for the proportion of non-farm jobs in the food system for different country income levels would support an estimate of c. 250 million non-farm food related businesses.
Averaging the alternatives we’ve explored suggests that an estimate of 200 million might be reasonable, giving a total food system business population of c. 700 million businesses.
Revenues outside our database could be over USD 4.49 trillion
Estimating the revenues produced by all these businesses is obviously difficult. Our database shows that the vast majority of businesses are small and that the revenues in the system are concentrated in the hands of a few very large businesses. As a result the average revenue per business is likely to be low5 even though a few businesses will have much higher revenues.
The majority of smallholders live at or below the level of a living income in their country.6 This data is difficult to gather so for simplicity we have assumed that smallholders will be generating revenues in line with the per capita Gross National Income for the country where they are based.7 The weighted average annual revenue figure that results from this calculation is USD 5,400 per smallholding.
If we assume that the non-farm businesses generate higher revenues on average (say 50%) then we can calculate the total revenues of the businesses outside out database (510m x $5,400 + 200m x 5,400 x (1+20%)): USD 4.4 trillion.
Giving an aggregate food system revenue total of nearly USD 15 trillion
Adding the USD 4.4 trillion revenues from businesses outside our database to our database figure of USD 10.2 trillion gives an overall food systems revenue figure of USD 14.6 trillion – around 16% of global GDP and implies that the 400,000 companies in our database account for 70% of the total system revenues.
Our estimated total revenue figure of USD 14.6 trillion is close to the USD 13.3 trillion estimate produced by KPMG8 in 2013 when inflation is allowed for.
An alternative revenue estimate (top-down protein-based approach)
An alternative way to estimate the revenues of the food system is top-down, using protein pricing and consumption data.
Table 1 shows the global average daily protein consumption in grams.
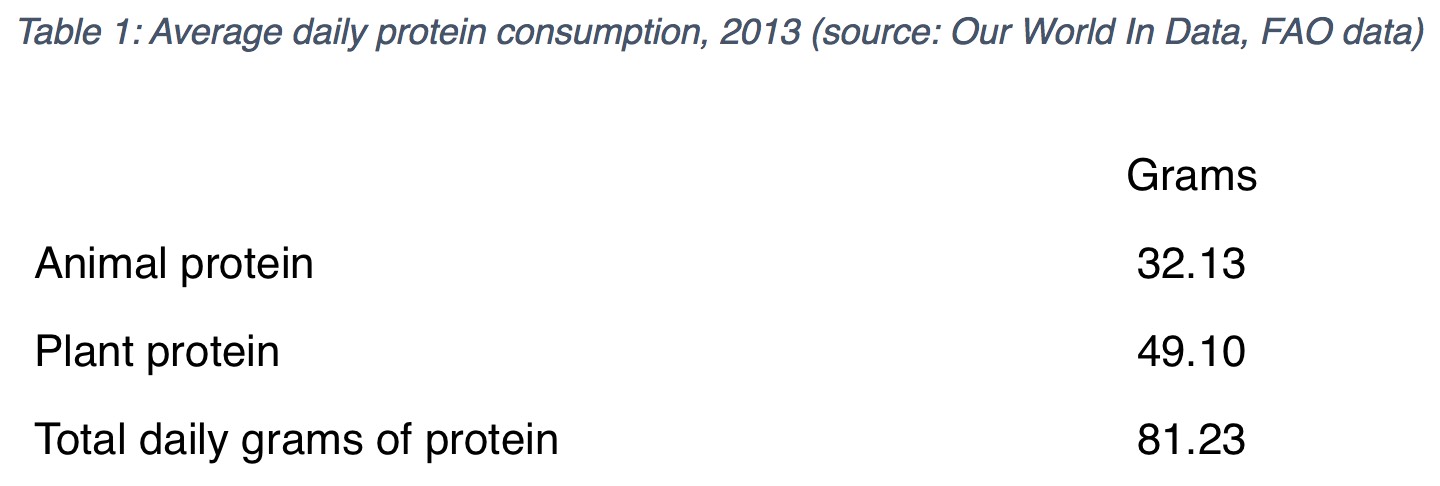
For our top-down estimate we need to apply protein prices to these figures to convert grams to dollars.
The WRI protein scorecard estimates that meat and fish protein retails for over USD 0.04 per gram whereas plant-based protein retails for less than USD 0.02.
A lower set of figures is provided by analysis published on Plenteousveg.com where the average meat protein price is estimated as USD 0.0297 and the average plant-based protein price is USD 0.0128.
Applying these prices to the protein consumption figures above, multiplying by a population of eight billion and annualizing the figures results in an estimated annual revenue figure of USD 19.2 trillion or USD 27.6 trillion.
In the context of our dataset the lower figure looks more plausible.9
Our food system dataset includes seafood and aquaculture. In a separate report, we have estimated the revenues for that component of the system as USD 1.8 trillion.
Valuing the food system based on revenues
Our valuation approach is as follows:
- Calculate a Price/Sales ratio for quoted food system companies.
- Apply this ratio to the aggregate system revenues to derive a system equity value.
- Calculate an aggregate Enterprise Value (EV) for quoted companies (EV = market cap + net debt)10
- Calculate an EV/Sales ratio for quoted food system companies.
- Apply this ratio to the aggregate system revenues to derive a system Enterprise Value.
- When applying the Price/Sales and EV/Sales ratios to unquoted companies in our database and all the smaller companies not in our database we assume a discount to reflect their illiquidity and higher risk.
Price/Sales ratio is 1.1x for quoted companies
The quoted companies in our database have an aggregate value of USD 5.5 trillion and revenues of USD 5.0 trillion.
The Price/Sales ratio is therefore 1.1x.
We discount this by 20% to apply to the revenues for unquoted companies in our database (to reflect their lower value due to being less easily traded by investors and exposed to greater risks due to their smaller size).
For the businesses outside our database, we apply a 90% discount to the multiple. This is to reflect the fact that many of these businesses are only marginally profitable (and in many situations are loss making). They provide a livelihood to the people running the farm, operating the small retailer or restaurant, but to an outsider they will not have much value since there is little left after the owners have paid themselves and all the other running costs. Again, it is worth noting that a minority of businesses will be very profitable and thus very valuable compared to their peers but when the population of businesses across the globe is taken as whole it is fair to assume the average is close to breakeven.11
Estimated equity value is c. USD 11 trillion
We apply the price/sales multiples to the different revenue streams as shown in Table 2.
Table 2: Equity valuation using price/sales multiples
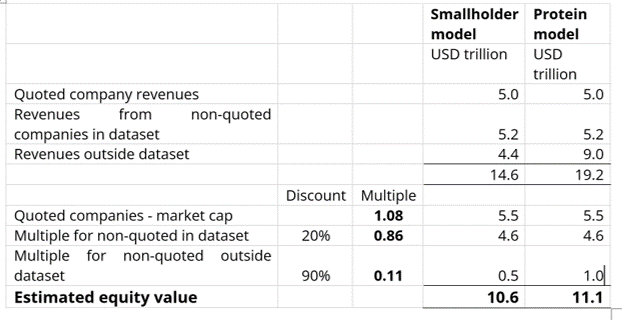
We estimate the value of the companies in our database is USD 10.1 trillion, implying that we have captured over 90% of the system’s USD 11 trillion equity value.
Enterprise or asset value is USD 13.56 trillion
The enterprise or asset value of the quoted companies in our database is USD 6.7 trillion. This value captures both the market value of the shares in the companies in our database and also the value of the debt provided to them.
We can use the ratio of this value to the revenues of the quoted companies to produce an asset value for the whole food system.
The EV/Sales multiple for quoted companies is 1.34x (EV of USD 6.7 trillion divided by revenues of USD 5.0 trillion).
As before, we apply a 20% discount to this multiple when using it to value the unquoted companies in our database.
For the businesses outside our database, we could apply the same discount as before (90%) given their assumed lack of profitability, but this might understate the value of the underlying assets (an outside shareholder might not pay much for the business given its low profits but a bank might look at the tangible assets as well when lending so a slightly higher overall value could be justified).
The final valuation result is very sensitive to this assumption so we have been cautious and kept the discount at 90%.
Table 3 summarises the results of our calculation – the overall enterprise (or asset) value of the global food system could be close to USD 14 trillion.
Table 3: Enterprise (asset) value based on EV/Sales multiples

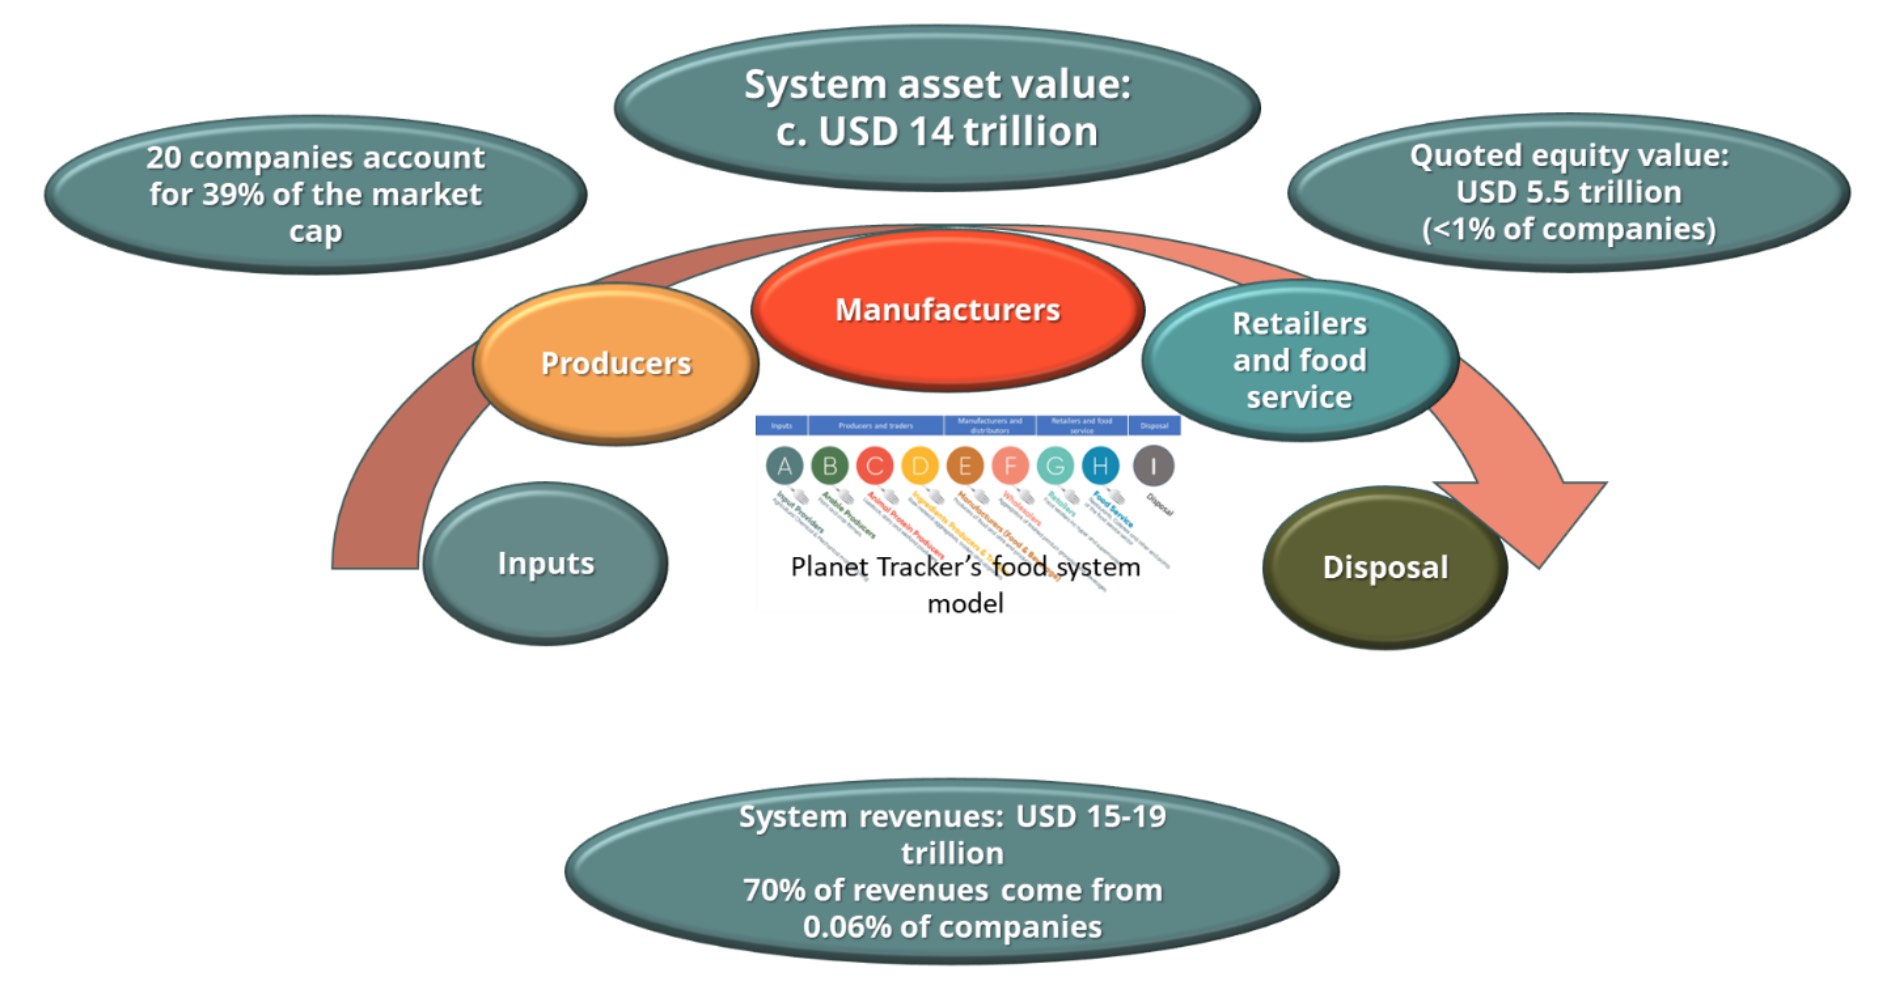
Summary – valuation of the global food system (USD 14 trillion)
Figure 3: Valuing the global food system (source: Planet Tracker). Disposal is included in our food system framework but not in this valuation due to lack of adequate data. Seafood and aquaculture is included.
References
1 External debts of the UK: USD 8.7 trillion, and Belgium: USD 1.3 trillion (source: CIA World Factbook)
2 Which farms feed the world and has farmland become more concentrated? Lowder et al, 2021, https://doi.org/10.1016/j.worlddev.2021.105455
3 European Union food system, EPRS Ideas Paper, EU Parliament 2020 https://www.europarl.europa.eu/RegData/etudes/BRIE/2020/652058/EPRS_BRI(2020)652058_EN.pdf
4 https://ec.europa.eu/eurostat/statistics-explained/index.php?title=Business_demography_statistics
5 The mean will be much lower than the median
6 The economic lives of smallholder farmers, George Rapsomanikis, FAO, 2015 https://www.fao.org/3/i5251e/i5251e.pdf
7 Lowder et al (2021)
8 https://assets.kpmg/content/dam/kpmg/pdf/2013/06/agricultural-and-food-value-chain-v2.pdf
9 To reconcile the higher figure to our bottom up approach would require the total number of food system businesses to be 1.9 billion instead of 0.7 billion, and that the non-farm businesses outside our dataset had average revenues of USD 10,800 (instead of USD 8,100), or variations around those figures.
10 We have ignored minorities, pensions and associates for simplicity
11 It is worth noting that our estimated equity value is not very sensitive to estimates of the revenues being generated outside our database because of the high valuation discount we have used. If we assumed the millions of small businesses were slightly more valuable then the overall system value would increase.
12 The Food and Land Use Coalition estimated the total value of the food system to be USD 10 trillion in 2018 based on updating several other estimates (source: Growing Back Better, FOLU, 2019).