Business can Benefit from New EU Food and Agriculture Strategies

Last month, the EU Commmission launched two groundbreaking strategies – Farm-to-Fork and EU Biodiviersity – both intended to decrease the natural capital footprint of the EU’s food and agriculture system. These two strategies are a positive advancement in the EU food and agrictulture framework and an important step forward in advancing sustainable practices as communities, investors and corporations will gain both from increasing the efficient use of capital and by decreasing waste along the food supply chain.
The EU is developing these strategies in response to the fact that, while global capital stocks per capita for produced capital – and financial capital – have increased since 1982, natural capital stocks globally have declined about 40% over the same period – see Figure 1.
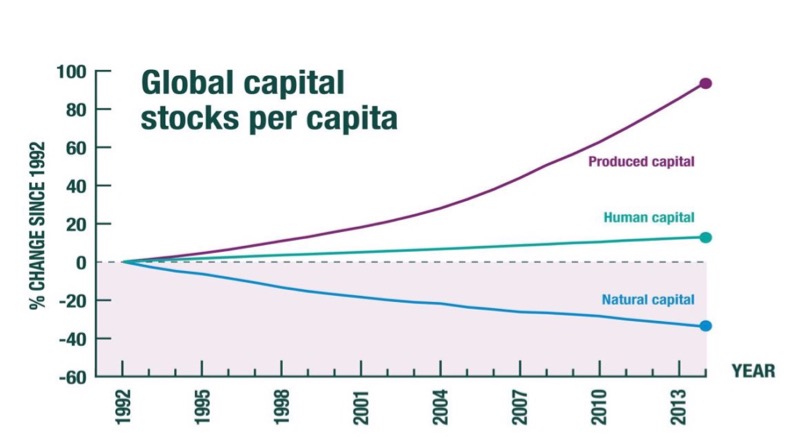
Figure 1: Graph of Changes in Global Capital Stocks. Source: Managi, S. and Kumar, P. (2018) Inclusive Wealth Report 2018. London.[i]
The EU Farm to Fork strategy has 27 concrete actions focused on food loss and waste prevention, sustainable food production, sustainable food processing and distribution and sustainable food consumption. The strategy has many goals, including the reduction of chemical pesticides by 50% to protect pollinators, decreasing the use of high-risk pesticides by 50%, supporting farmers to move to regenerative agriculture and agro-ecological practices.
The strategy also aims to reduce antimicrobial use in husbandry of farm animals by 50%, decrease fertilizer use by 20% and increase organic farming to 25% of the total market share. There exist many other components to the plan regarding food labelling accuracy, reducing food loss and waste in the agriculture sector and decreasing EU greenhouse gas emissions from the agriculture sector, which is responsible for 10.3% of greenhouse gas emissions overall in the EU and 7% of the EU’s overall emissions from animal husbandry alone.
Finally, the strategy includes a significant food and agriculture systems research and development plan to encourage and enable business innovation.
The EU Biodiversity strategy is focused on expanding protected areas and ecosystem restoration. Based upon the 1979 EU Birds and the 1992 EU Habitats Directives, and building upon the Natura 2000 network that covers 18% of the EU’s land area and almost 6% of its marine territory and is the largest coordinated network of protected areas in the world, the strategy will establish a Trans-European Nature Network covering 30% of Europe’s lands and seas with 10% strictly protected. Equally important, and building upon this foundation, the strategy seeks to restore 30% of degraded habitats to conservation status.
This strategy will protect what little nature remains – such as old growth forests – and aspires to restore ecosystems such as peatlands, sea grass-meadows and wetlands that manage the hydrological systems upon which EU agricultural communities and cities depend.. The strategy will also restore 25,000 kilometres of EU rivers to a free-flowing state and plant three billion trees. Funding of EUR 20 billion comes from the EU budget as well as the private and philanthropy sectors.
Businesses depend on the global commons – natural capital – to provide material services that impact real-world economics. Businesses need clean water to function. Staff need healthy food to be productive and decrease recidivism. Pollinators are essential to much of the food we eat, contributing up to $577 billion to global food production.
Just looking at food loss and waste alone, the economics are clear. The United Nations Food and Agriculture Organisation (FAO) estimates 24% of all human food calories produced are wasted from farm to fork. Furthermore, food loss and waste between post-harvest and the retail stage of the food supply chain, roughly 14% of total food production, is estimated to cost $400 billion per annum.[ii] Overall, food loss and waste direct and indirect economics costs are equal to $1.2 trillion loss – or 36% of 2018 total agricutlure contribution to GDP. [iii]
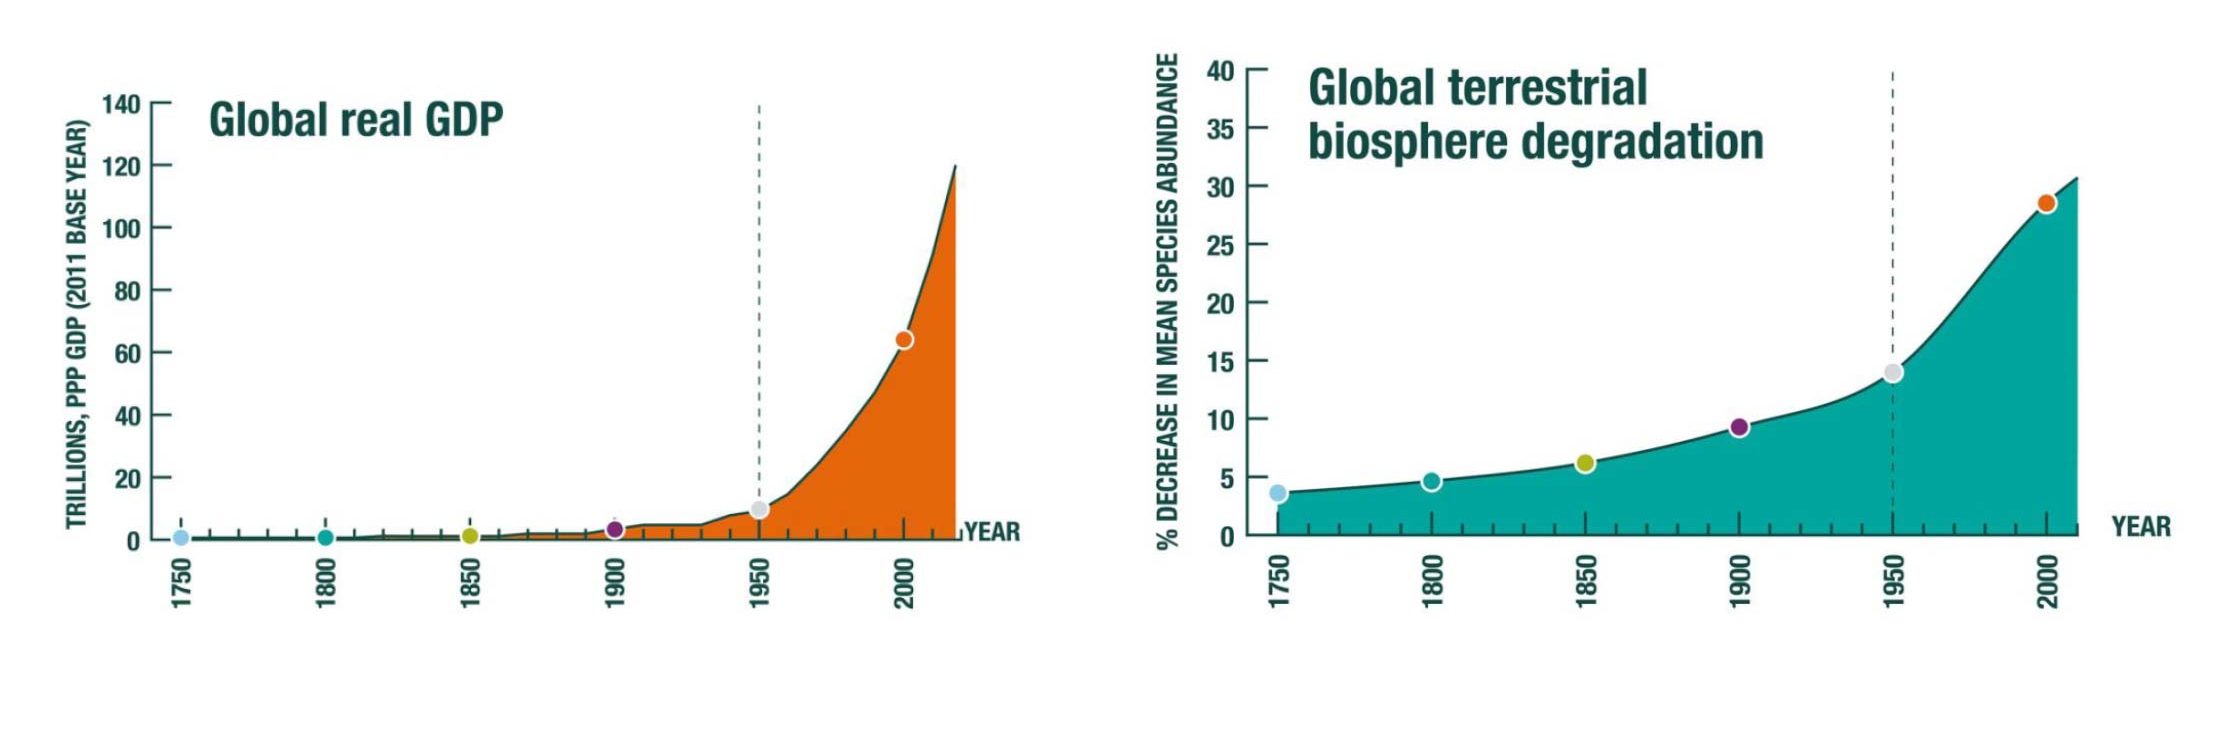
Figure 2: Global Real GDP vs. Global Terrestrial Biosphere Degradation.[iv]
As shown in Figure 2, as global real GDP has increased so has global terrestrial biosphere degradation. In other words, as a society, we are eating our seed corn. Business must embrace the new regenerative agriculture and food systems economy, just as business has embraced other macroeconomic trends like the transition from analog to digital, the transition from typewriters to computers and the transition to online business. Otherwise, nature’s contribution to our health and livelihoods will continue to decline, as shown in Figure 3.
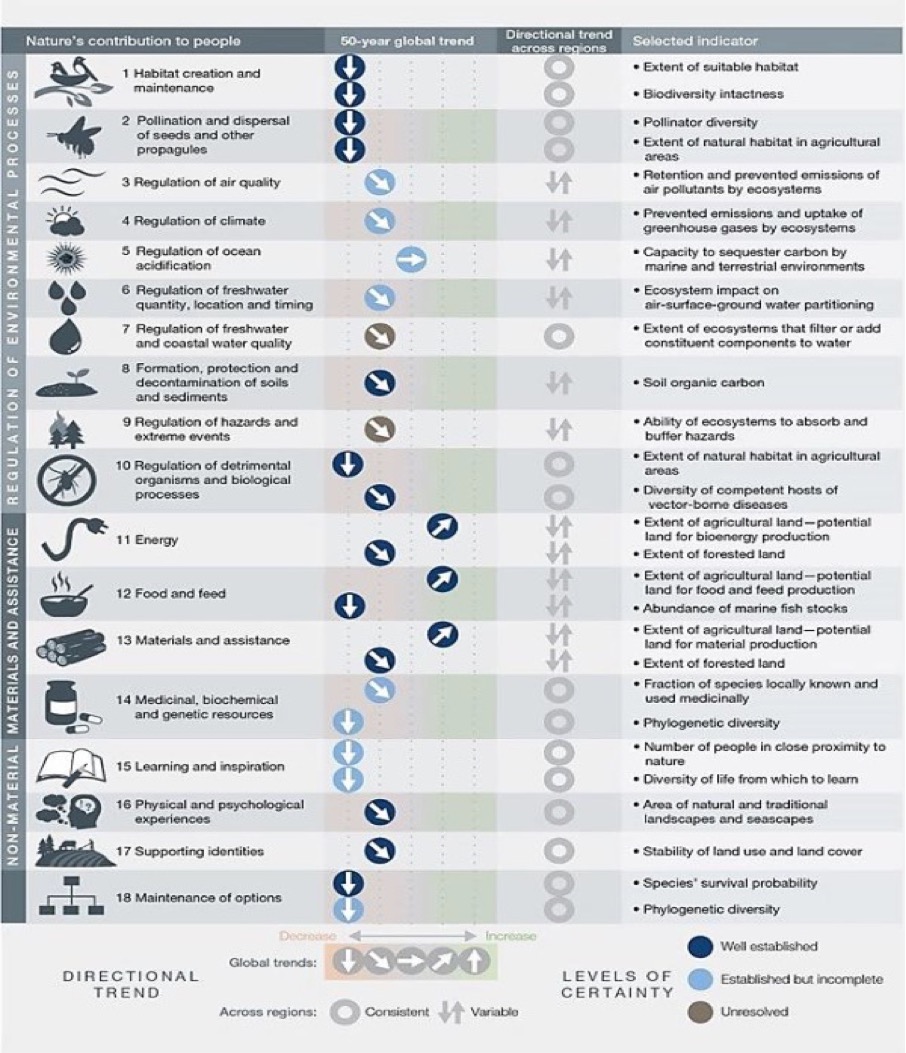
Figure 3: Global Trends in the Capacity of Nature to Sustain Contributions to Good Quality of Life from 1970 to the Present.[v]
The EU’s new strategies are both a win for nature and a win for business. They create a framework within which EU businesses can now develop their sustanaible business strategies – long-term action plans to integrate natural capital into their business plans, competitive analysis and product development, sourcing and marketing approaches. At the same time, management can now incorporate natural capital into their game plan to build the resilience of their companies to natural capital risks and to improve the efficient use of investor capital by taking advantage of the opportunities described in detail in the EU’s Farm-to-Fork and EU Biodiviersity Strategies.
[i] Dasgupta, United Kingdom HM Treasury (2020). The Dasgupta Review – Interim Report of the independent Review on the Economics of Biodiversity led by Professor Sir Partha Dasgupta.
[ii] Sukh, McLuckie, and Thoumi, CFA, FRM, Planet Tracker (2020). Scope for Improvement: Accounting for food loss and waste in Scope 3 reporting.
[iii] World Bank national accounts data, and OECD National Accounts data files (2018). Agriculture, forestry, and fishing, value added (current US$). Agriculture (code is NV.AGR.TOTL.CD) corresponds to ISIC divisions 1-5 and includes forestry, hunting, and fishing, as well as cultivation of crops and livestock production. Value added is the net output of a sector after adding up all outputs and subtracting intermediate inputs. It is calculated without making deductions for depreciation of fabricated assets or depletion and degradation of natural resources. The origin of value added is determined by the International Standard Industrial Classification (ISIC), revision 3. Data are in current U.S. dollars.
[iv] Dasgupta, United Kingdom HM Treasury (2020). The Dasgupta Review – Interim Report of the independent Review on the Economics of Biodiversity led by Professor Sir Partha Dasgupta.
[v] Dasgupta, United Kingdom HM Treasury (2020). The Dasgupta Review – Interim Report of the independent Review on the Economics of Biodiversity led by Professor Sir Partha Dasgupta.